Walking speed in smoke
Smoke slows people down because they see less, and irritant smoke slows them further because it hurts their eyes and airways. Evacuation models take this from a small number of experiments that relate walking speed v [m/s] to the extinction coefficient K [1/m] (see Extinction coefficient). The data sets were recorded under different conditions and are not interchangeable (Ronchi et al. 2013).
Symbols follow the notation table; each section keeps its source’s notation: Korhonen’s \(K_s\), \(v_i^0\); Purser’s \(\alpha_k\) (= K, not the coefficient \(\alpha\)); Fridolf et al.’s w, x (S in the notation table) and A, which plays the role of C with its own values.
| Law | Variable | Equation | Data range | Reduction | Smoke |
|---|---|---|---|---|---|
| Jin, non-irritant (Purser’s fit) | K | v = 1.0573 − 0.4326 K | points 0.5–1.13 1/m (Purser: 0.2–1.13) | absolute | kerosene, less irritant |
| Jin, irritant (Purser’s fit) | K | v = 1.1517 − 0.9578 K | points 0.32–0.47 1/m (Purser: 0.32–0.5) | absolute | wood cribs, highly irritant |
| Purser 2003, fit to Jin, non-irritant | OD/m (K ≈ 2.303 OD/m) | F = 1.236 − 1.738 OD/m | Purser’s stated range OD/m 0.13–0.55 (K ≈ 0.30–1.27 1/m); Jin’s data K ≈ 0.5–1.13 1/m | fractional | non-irritant |
| Frantzich–Nilsson, Eq. 3 | K | v = 0.706 − 0.057 K | 1.9–7.4 1/m | absolute | artificial, mild (acetic acid) |
| FDS+Evac, Eq. 11 | K | v = max(0.1 v₀, v₀ (1 − 0.057 K / 0.706)) | as Frantzich–Nilsson | fractional | as Frantzich–Nilsson |
| Purser, Eq. 70.8 | K | W = −0.1364 ln K + 0.6423 | 0.32–0.5 and 1.9–7.5 1/m | absolute | pooled, “moderately irritant” |
| Fridolf et al., Eq. 2 | x = A/K | w = 0.34 x + 0.31 | x ≈ 0.3–3 m | absolute | mostly non-irritant |
| Fridolf et al., Eq. 7 | x | w = min(w_sf, max(0.2, w_sf − 0.34 (3 − x))) | design rule | both | as Eq. 2 |
Jin: irritant and non-irritant smoke
Jin (1976, FRI Report No. 42, pp. 12–15) had ten men aged 23–37 walk (one at a time, in our reading) along a 20 m corridor filled with highly irritant white smoke (burning wood cribs) or less irritant black smoke (burning kerosene). Report Fig. 2 plots speed against K [1/m]: non-irritant points at K ≈ 0.5–1.13 1/m, irritant points at 0.32–0.47 1/m, with trend lines but no equation. In irritant smoke the speed dropped sharply, and subjects walked zigzag or along the wall because tears ran too heavily to see (pp. 14–15). Jin (1978, pp. 144–148, Figs. 8–10, citing the report as ref. 11) restates these results in English; his Fig. 8 appears to redraw report Fig. 2 (our comparison by eye), without the horizontal line for walking in darkness.
Purser and McAllister (2026, SFPE Handbook, 6th ed., Ch. 70) replot Jin’s data in their Fig. 70.10 and fit straight lines to them (legend), over a stated K = 0.2–1.13 1/m (non-irritant) and 0.32–0.5 1/m (irritant) (p. 2285):
$$ \begin{aligned} v &= 1.0573 - 0.4326\,K && (\text{non-irritant},\ R^2 = 0.27),\\ v &= 1.1517 - 0.9578\,K && (\text{irritant},\ R^2 = 0.035). \end{aligned} $$Jin’s data: sources, ranges, darkness and participants
Setup. Subjects wore no air masks and waited in a normally lit room before entering (text below Table 1, p. 13). The corridor was lit (about 80 lx at the floor) or blacked out (0.1–0.5 lx from the sign and the meters), and the two gave the same speeds (p. 15). In the blackout runs the sign also switched from a 10 W fluorescent lamp to three 2.5 V tungsten bulbs (Jin 1972, abstract and p. 13), so the comparison changes corridor light and sign luminance together. Speed came from a wire each subject unwound from a reel, averaged over the whole corridor including stops (pp. 12, 15); K came from two 4 m-path and one 1 m-path light meters 1.5 m above the floor (p. 13).
Scatter. The irritant fit explains almost none of the scatter: at an average K = 0.42 1/m the speeds ranged from 0.37 to 1.1 m/s, mean 0.75 m/s (standard deviation (SD) 0.21). In non-irritant smoke, at an average K = 0.73 1/m, the mean was 0.74 m/s (SD 0.17) (Ch. 70, p. 2285).
Ranges. Report Fig. 2 has no non-irritant point below about 0.5 1/m; Jin (1997, Fig. 3) redraws the same data. Purser and McAllister’s non-irritant point at K ≈ 0.2 1/m (about 1.1 m/s) sits, in our reading, at the start of Jin’s drawn non-irritant trend line, not on a measured point, and their replotted speeds lie a few hundredths of a m/s below Jin’s. Their stated range 0.2–1.13 1/m is therefore that of the trend line; Jin’s points cover about 0.5–1.13 1/m. In report Fig. 2 the irritant trend line starts near 0.30 1/m and stops near 0.47 m/s, so Ronchi et al.’s “1.0 to 0.3 m/s as K rose from 0.1 to 0.5 1/m” (p. 414) does not follow it; in our inference it follows Jin (1997, Fig. 3), where the non-irritant curve starts near 0.1 1/m and the irritant dotted line falls towards zero.
Darkness. The 0.3 m/s is not a measurement in this experiment. Jin writes that as smoke thickens “the condition becomes very much like walking in darkness (0.3–0.7 m/s)”, citing Togawa (1969) for that range (report p. 14), and calls 0.3 m/s “the speed in darkness shown by a horizontal broken line in Fig. 2”, without a citation (p. 17). Jin (1978, p. 148) ties the 0.3 m/s to Togawa: “the speed in darkness (0.3m/s [19])”, ref. 19 being Togawa (1969), not read, so what Togawa measured or assumed is still unknown. Jin (1978, p. 146) repeats that walking speeds in the lit and the blacked-out corridor showed “no differences” in his Fig. 8. Jin takes the density at which the average speed slows to 0.3 m/s as the maximum for people familiar with the building, “approximately 0.5/m–1.2/m” (p. 17). No non-irritant point in Fig. 2 is below about 0.45 m/s, so the 1.2 1/m end rests on the trend line extended (our reading). In our inference, Ch. 70’s “at an extinction coefficient of 1.15 … approximately 0.3 m/s” (p. 2285) and “has been shown” (p. 2341), Ronchi et al. (p. 415) and Purser (2003, p. 98) all go back to this reference line; the 1.15 1/m itself is not in the report (pp. 12–18). Ch. 70 pairs K 1.15 with OD/m 0.55 in its prose (p. 2285) but with OD/m 0.5 in Table 70.3 (p. 2284); only 0.5 is consistent with base 10.
Allowable smoke density. Two routes lead to Jin’s conclusion. From the minimum visibility proposed by others (3–5 m if familiar, 15–20 m if not) and the rule “Visibility (m) × Extinction coefficient ≈ 2” (p. 17, citing Jin 1971, FRI Report 33), Table 3 gives 0.4–0.7 1/m for familiar people and 0.1 1/m for strangers. From the walks, the density that slows the average speed to 0.3 m/s gives 0.5–1.2 1/m for familiar people, and the density below which irritancy does not affect speed gives 0.2–0.3 1/m for strangers (p. 17). The conclusion merges the two: about 0.4–1.2 1/m for familiar people and 0.1–0.3 1/m for strangers (p. 18). Jin (1978, Table 3, p. 147, and p. 148) repeats Table 3, “where \(C_s \cdot V\) = 2”, without citing FRI Report 33, gives 0.5–1.2 1/m for familiar people and “approximately 0.2/m” for strangers from the walks, and has no merged conclusion; his Table 2 adds Rasbash’s 10 m and 0.2 1/m.
Speed against sign visibility. Report Fig. 4 and Jin (1978, Fig. 9, p. 145) plot walking speed against the distance at which the words of the EXIT sign became legible to each subject: about 3.4–12.8 m and 0.45–1.1 m/s (our reading), with a drawn rising line and no equation. Jin (1978, p. 145) writes that walking speed “will be affected more strongly by the visibility range than the degree of irritation”.
Group walking. Report Fig. 5 and Jin (1978, Fig. 10, p. 146) show Horiuchi’s data, cited secondhand (Horiuchi, Murozaki and Jin 1974, not read): 20 groups of five to seven people led by someone familiar with the building walked a corridor in smoke-bomb smoke of about 0.6 1/m, with drawn mean lines near 1.85 m/s (lit) and 1.57 m/s (blackout) (our reading), “about 1.5 times faster” than Jin’s single subjects (p. 146).
Irritant smoke. The report (p. 13) and Jin (1972, p. 12, Japanese text, our translation) describe burning wood cribs with very narrow spacing; the English abstract of Jin (1972, p. 11) calls the same smoke “generated from smoldering wood (nearly white smoke)”. Purser’s “smoke from non-flaming wood” (2003, p. 98) matches that abstract; Ch. 70’s “heating wood chippings” (p. 2285) may, as our inference, mix it up with the wood-chip furnace smoke of Jin and Yamada (1985, 1989).
Source chain. FRI Report No. 42 (September 1976, p. 12) states that the distance at which the sign became visible was recorded “and at the same time the speed at which each subject managed to walk”, citing ref. 1, Jin (1972); Jin (1972) used the same corridor and the same ten observers (its Table 1 is identical) and reports the sign visibility. Jin and Yamada (1985, §3 and Fig. 3, p. 82) reprint the walking data as “an example data of the experiment … conducted before”, without a citation for the figure; their ref. [5], Jin (1978), is attached to the corridor-task sentence on p. 81; Jin 1978 does contain the corridor figures (Figs. 6–9). Jin (1997, §1.3 and Fig. 3) repeats that section almost word for word and cites it as ref. [2], with pages 79–89; the paper’s header and Crossref give 79–90, and the scan ends at p. 89. Purser (2003) dates Report No. 42 1975; the cover says 1976. Fridolf et al. (2019) name the study Jin 1976 (Fig. 1 legend), Jin 1978/1997 (§3.2.1) and Jin 1979 (Table 2).
Participants. Ronchi et al. (p. 414) report 17 women and 14 men aged 20 to 51. That is the population of Jin and Yamada’s 11 m corridor study of emotional instability (Jin and Yamada 1989, “Subjects”, p. 513; Jin 1997, §2.2). The walking study had ten men aged 23–37 (report Table 1), as Fridolf et al. (2019, Table 2) state.
A third data set. Jin and Yamada (1989) also measured walking speed against K (Fig. 7, p. 517), with smoke from smouldering Japanese cedar crib chips in an electric furnace, set to 1.2 1/m and decaying to about 0.1 1/m over 30 minutes (p. 512, “Experimental condition of the corridor”), under radiant heat. The subjects breathed through a 16-layer towel that removed about 90 % of the smoke and lessened its irritation (pp. 513, 517), so these data do not give a law for unprotected walkers.
Purser 2003: a fractional law fitted to Jin
Purser (2003, p. 93 and pp. 98–99, Fig. 1) fitted “a curve directly to Jin’s data” on non-irritant smoke (refs. 7 and 15: Jin’s FRI Report No. 42, which he dates 1975, and Purser’s own 2001 paper “Human Tenability”) with a fraction F of the unexposed walking speed:
$$ F = -1.738\;\mathrm{OD/m} + 1.236, \qquad 0.13 \le \mathrm{OD/m} \le 0.55, $$with normal speed below OD/m = 0.13 and, above 0.55, speed “as in darkness at 0.3 m/s … since it is still possible to move at this speed in total darkness”. With K = ln 10 · OD/m the stated range is K ≈ 0.30–1.27 1/m (our conversion), but Jin’s non-irritant points span only about 0.5–1.13 1/m (OD/m 0.22–0.49): K 0.30 lies below every non-irritant point. The 0.3 m/s floor is Jin’s reference line for walking in darkness, not a measured point (Jin 1976, pp. 14, 17).
The fraction multiplies the unexposed walking speed (p. 98). Purser combines it with the fraction for irritants by adding the two losses, not by multiplying the fractions (p. 99; Ch. 70, Eq. 70.12); see Irritants and walking speed.
Caveats on Purser’s 2003 law
Units. Purser does not define OD/m; Ch. 70 defines it as log₁₀(I₀/I) over 1 m (p. 2341). Jin and Yamada (1985, p. 80, footnote) define the extinction coefficient with the natural log; applying that definition to the 1976 data is our inference, hence the factor ln 10.
Range. The upper end, OD/m 0.55 (K ≈ 1.27 1/m), is close to the top of Jin’s “approximately 0.5/m–1.2/m” (p. 17) but matches neither Jin’s 1.2 (OD/m 0.52) nor Ch. 70’s 1.15 (OD/m 0.50); in our inference it comes from Ch. 70’s prose pairing of 1.15 with OD/m 0.55 (p. 2285). It lies beyond Jin’s measured points.
Fit. No fit quality or number of points is given, and the squares in Fig. 1 lie exactly on the line (1.010, 0.888, 0.715, 0.541, 0.454, 0.280 at OD/m 0.13–0.55), so Fig. 1 shows the fitted line, not Jin’s points.
Floor. It is written as an absolute 0.3 m/s (0.25 of the 1.2 m/s unexposed speed that Ch. 70 uses; FRI Report No. 42 gives no such value), while the line reaches 0.28 at OD/m 0.55 and Fig. 1 shows about 0.27.
Frantzich and Nilsson: a linear regression in dense smoke
Frantzich and Nilsson (2003, Lund report 3126) sent 46 young volunteers one at a time through a 36.75 m tunnel filled with artificial smoke made irritating with acetic acid. For the 32 runs with the lighting on, a linear regression (report Eq. 3, Table D2, model 1) gave the absolute speed
$$ v = \alpha + \beta K, \qquad \alpha = 0.706~\mathrm{m/s}\;(\text{s.e. } 0.069),\quad \beta = -0.057~\mathrm{m^2/s}\;(\text{s.e. } 0.015), $$with \(R^2\) = 0.342 (Table D3); the bracketed values are standard errors of the coefficients, not the spread between people. The lit runs cover K ≈ 1.9–7.4 1/m (Fig. 9).
More on the Frantzich–Nilsson data
Participants. 30 men and 16 women, mean age about 22, mostly students (Table 1). The 32 lit runs pool four wayfinding scenarios, 1–4 in Table 3.
Measurement. K is the mean of two laser extinction meters (670 nm, 1 m path, 2.0 m above the floor), averaged over each person’s time in the tunnel (§2.5.1, App. D). The walking speed is the distance each person actually walked, measured from the video on the tunnel plan, divided by the time in the tunnel, stops included (§3.3.1). The speed over the straight-line distance to the chosen exit (the “gross speed”, Fig. 12) was on average 0.88 of it (SD 0.09; Fig. 11). Measured speeds ranged from 0.2 to 0.9 m/s (§3.3.1), although the lit points in Fig. 9 reach only about 0.76 m/s.
Smoke and light. The acetic acid concentration was 10–15 ppm (§2.3). Fridolf et al. (2019, Table 2) call the smoke “semi-irritant”, and Ronchi et al. (2013, p. 421) call the irritation much less severe than in Jin’s experiments. It follows, as our inference, that the regression already includes the effect of this mild irritancy. The ceiling lighting gave 2–21 lx without smoke and 0–8 lx with smoke (§2.2).
Range and scatter. The report’s text gives K ≈ 2–7 1/m (§3.2). The 95 % prediction interval at K = 4 1/m is about 0.2–0.7 m/s (§3.3.2); adjusted \(R^2\) is 0.320.
Other models. With the lighting off (12 runs) the slope was not significantly different from zero (Table D1). A second model with the share of the route walked along the wall fitted better (Eq. 4, Table D2 model 2: α = 0.692 m/s, β₁ = −0.073 m²/s, β₂ = 0.139 m/s per unit share; adjusted \(R^2\) 0.416 against 0.320): walking along the wall raised the speed. For dense smoke (K = 8 1/m) the authors state that a randomly chosen person could walk at anything between 0 and 0.6 m/s (§5), and expect a real population to do worse than their young, fit participants (§3.1.1).
The fractional form is FDS+Evac’s normalisation
FDS+Evac, the evacuation module of the Fire Dynamics Simulator (FDS), divides the regression by its intercept α and scales each agent’s unimpeded speed \(v_i^0\) by the result (Korhonen 2021, Eq. 11):
$$ v_i^0(K_s) = \max\!\left(v^0_{i,\min},\; v_i^0\left(1 + \frac{\beta}{\alpha}K_s\right)\right), \qquad v^0_{i,\min} = 0.1\,v_i^0 \text{ by default.} $$The divisor 0.706 m/s is an extrapolation to K = 0, not a measured free walking speed. Ronchi et al. (2013) call the two readings fractional and absolute, and show that they give different evacuation times.
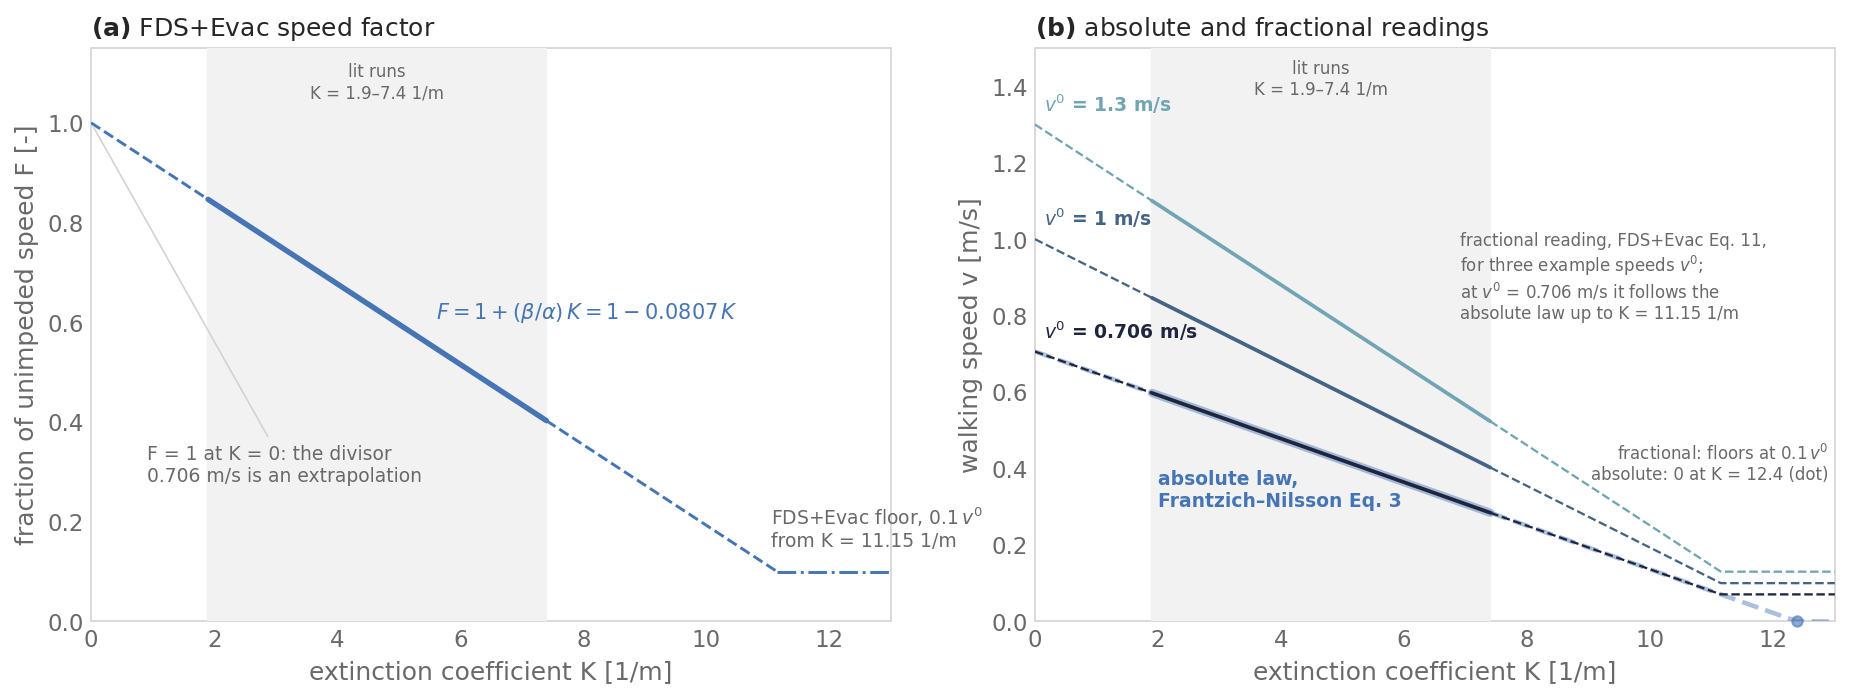
(a) The FDS+Evac factor \(F = 1 + (\beta/\alpha)K = 1 - 0.0807\,K\) with
the Frantzich–Nilsson constants (Korhonen 2021, Eq. 11). Solid over the lit
runs (K ≈ 1.9–7.4 1/m), dashed outside them. F reaches the floor 0.1 at
K = 11.15 1/m. (b) The absolute law (Frantzich and Nilsson 2003, Eq. 3)
and the fractional reading for three example unimpeded speeds. At
\(v^0\) = 0.706 m/s the two readings agree up to K = 11.15 1/m; for any
\(v^0\) above 0.706 m/s they differ at every K. The absolute law reaches 0 at
K = 12.4 1/m, where the fractional reading stays at \(0.1\,v^0\).
Script: scripts/figures/fundamentals_speed_fractional.py.
Purser: a logarithmic fit for irritant smoke
Purser and McAllister (2026, Ch. 70, p. 2287) pooled Jin’s irritant data with Frantzich and Nilsson’s and fitted a logarithm, which they suggest for a simple, deterministic and most conservative estimate of the average walking speed in moderately irritant smoke:
$$ W_{\mathrm{smoke}}~[\mathrm{m/s}] = -0.1364\,\ln \alpha_k + 0.6423 \qquad \text{(Eq. 70.8)} $$with \(R^2\) = 0.50 (Fig. 70.10) and a population SD of 0.157 m/s (pp. 2287, 2341), on pooled data at \(\alpha_k\) = 0.32–0.5 and 1.9–7.5 1/m, with none in between (pp. 2285–2286).
Caveats on Eq. 70.8
Pooling. The fit combines smoke from fires with artificial smoke made mildly irritating, which is the pooling the Known limits section warns against; Purser and McAllister do it deliberately, as a conservative envelope.
Behaviour outside the data. The logarithm has no upper bound as \(\alpha_k \to 0\): it exceeds 1 m/s below \(\alpha_k\) ≈ 0.07 1/m (our arithmetic).
Other fits on the same page. Fig. 70.10 also gives logarithmic fits to other combinations of the Jin, Frantzich–Nilsson and Fridolf et al. data (Ch. 70 ref. 40, Fire and Materials 38(7), 744–759, 2014, doi:10.1002/fam.2217); the three that leave out the Fridolf data are “quite similar” (p. 2287). Ch. 70 takes the Frantzich–Nilsson data from their 2004 Human Behaviour in Fire paper (ref. 39), not from report 3126, and its straight-line fit to them, v = 0.7099 − 0.0573 K (\(R^2\) = 0.349), differs slightly from the report’s.
Population values. p. 2287 also suggests drawing each person’s speed from a normal distribution “with a mean from Eq. 70.10 and standard deviation of 0.125”; Eq. 70.10 is the irritant FIC sum, so the reference is probably meant to be Eq. 70.8, and 0.125 differs from the 0.157 given on the same page. For clear air it suggests a mean of 1.2 m/s with SD 0.157 m/s (p. 2287). It compares Frantzich and Nilsson’s mean of 0.45 m/s (SD 0.21) with Jin’s 0.3 m/s in dense smoke, noting that the slowest speed measured by Jin was 0.37 m/s (p. 2286); Frantzich and Nilsson measured 0.2–0.9 m/s.
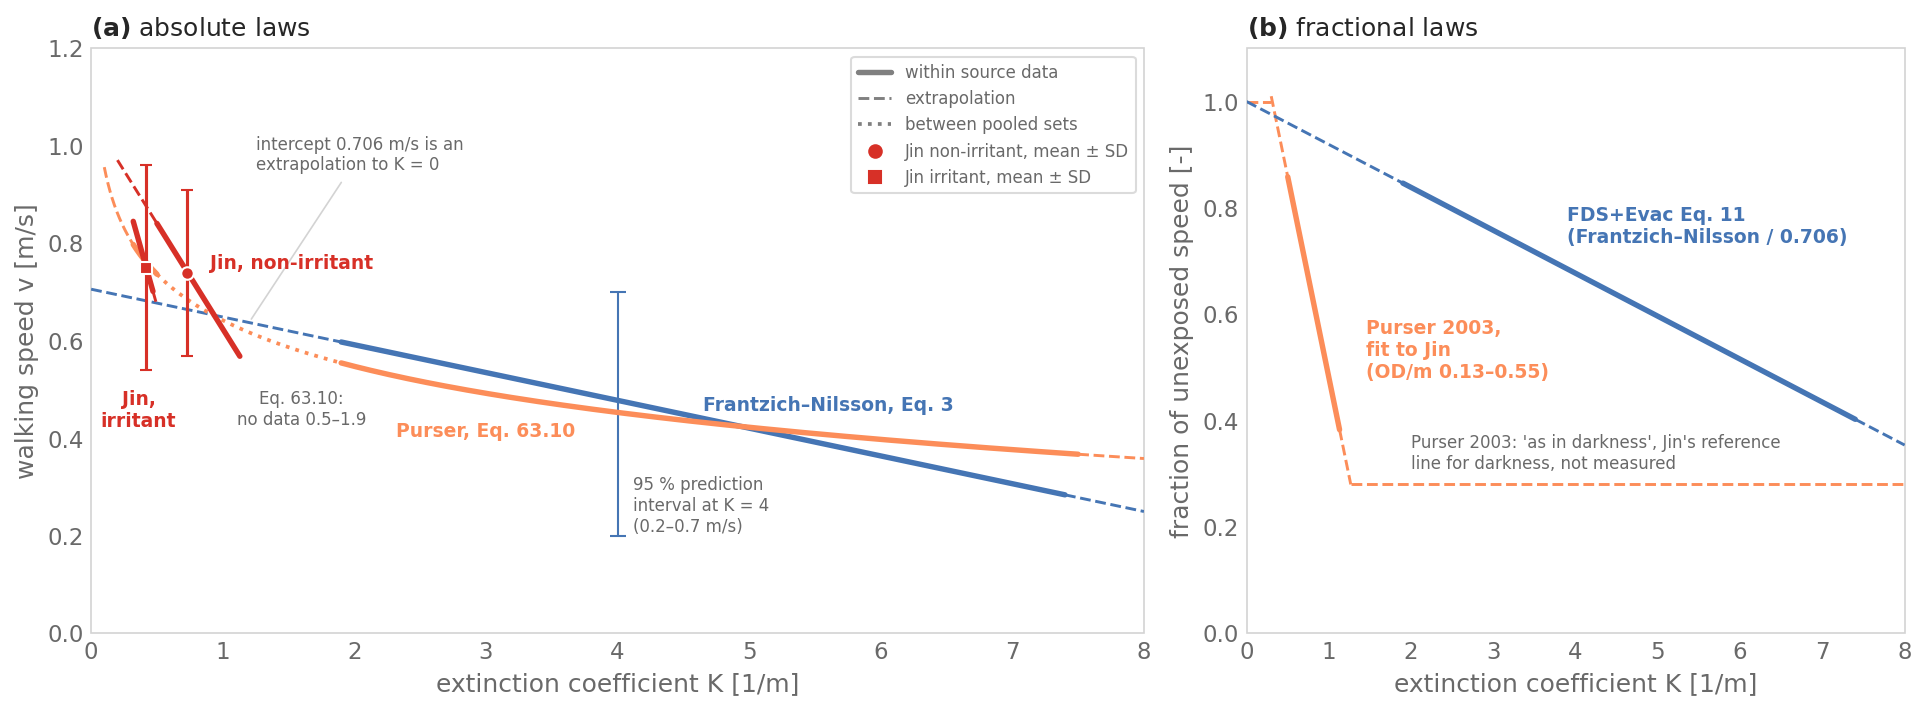
(a) Absolute laws against K [1/m]: Purser’s fits to his replotted Jin data (red, solid over Jin’s points, dashed over Purser’s wider stated range; mean ± 1 SD), Frantzich–Nilsson with its prediction interval (blue), Purser Eq. 70.8 (orange). (b) Fractional laws: Purser 2003 (orange, solid over Jin’s points), relative to the unexposed speed, and FDS+Evac Eq. 11 (blue), relative to 0.706 m/s, itself an extrapolation, so part of the gap is the reference. Purser’s floor, Jin’s reference speed for walking in darkness, is drawn at 0.28 (our construction; he writes 0.3 m/s, Fig. 1 shows about 0.27). Solid: source data; dashed: extrapolation or assumption.
Figure provenance
scripts/figures/fundamentals_speed_extinction.py.Fridolf et al. 2019: speed as a function of visibility
Fridolf, Ronchi, Nilsson and Frantzich (2019) reviewed smoke experiments from seven countries and express walking speed w [m/s] against visibility \(x = A/K_s\) [m], with A = 2 for light-reflecting and 8 for light-emitting items (Eq. 1, citing Jin 2008). Fitting six data sets, including Frantzich and Nilsson’s, gives
$$ w = 0.34\,x + 0.31 \qquad \text{(Fridolf et al. 2019, Eq. 2)} $$with \(R^2\) = 0.54 on data at x ≈ 0.3–3 m, none between about 1.17 and 1.78 m (Fig. 3); the authors call it a first approximation (§3.3.3). For design, each person’s clear-condition speed is reduced by 0.34 m/s per metre of visibility below 3 m, down to 0.2 m/s:
$$ w = \min\!\left(w_{\text{smoke free}},\; \max\!\left(0.2,\; w_{\text{smoke free}} - 0.34\,(3 - x)\right)\right) \qquad \text{(Eq. 7)} $$Eq. 7 is a design rule: the slope of Eq. 2 plus two thresholds chosen for conservatism (§3.3.2). Above 3 m, speed is taken as unaffected. The same rule appears in Fridolf, Nilsson, Frantzich, Ronchi and Arias (2018, pp. 4–5 of the extended-abstract PDF) as method 3, an English summary of their 2016 Swedish SP report, with w and w_smoke free in m/s and visibility v in m; their method 1 is the same with w_smoke free = 1 m/s. They describe the reduction as a combination of absolute (the same 0.34 m/s per metre for everyone) and fractional (starting from each person’s own clear-condition speed), never let the speed fall below 0.2 m/s, and give no constant for turning K into visibility.
Caveats on Fridolf et al.’s laws
The visibility constant. A is chosen for each data set from its lighting (§3.3.1); the paper does not list which A was applied to which set. Jin (1970, English abstract, p. 1) gives V = (5–10)/Cₛ for light-emitting and (2–4)/Cₛ for reflecting signs, repeated by Jin and Yamada (1985, p. 81) and Jin (1997, Eqs. 3–4). Jin (1971, Fig. 1) and Jin and Yamada (1985, Fig. 1) draw the line Cₛ·V = 8 for light-emitting signs, which matches A = 8; A = 2 is the lower end of the reflecting range, and Jin (1976, p. 17, citing Jin 1971, FRI Report 33) uses “Visibility (m) × Extinction coefficient (1/m) ≈ 2” to turn the visibility needed for escape into an allowable density. FDS uses C = 3 for reflecting signs by default (see Visibility through smoke). A = 2 is also the constant Frantzich and Nilsson (2003, report Eq. 2) used for lit walls and objects. Jin’s constants come from a chamber lit at 22–180 lx (Jin 1970, Figs. 5–11) and from signs at 40–80 lx (Jin 1971, Figs. 1–2); the σV of 5–8 that Cheung et al. (2026, §4.1, Fig. 8) take from Jin for light-emitting signs refers to 180 lx; in dimmer light the constant for light-emitting signs is larger (see Do the sources conflict?).
The data sets. Jin’s non-irritant data only, Frantzich and Nilsson (2003), Akizuki et al. (2007), Fridolf et al. (2013, 2014), Ronchi et al. (2017) with Fridolf et al. (2015), and Seike et al. (2016) (§3.3). They include an older group (Akizuki et al., mean age 70) and walks of up to 700 m (Table 2). Frantzich and Nilsson’s data are an input to Eq. 2, so the two laws agreeing is not an independent check.
The data range. The points in Fig. 3 span x ≈ 0.3–3 m, with none between about 1.17 and 1.78 m. The value at x = 0, 0.31 m/s, is an extrapolation. In terms of K, x = 0.3–3 m corresponds to K = A/3 to A/0.3 (our arithmetic; each data set was converted with its own A).
Speed definitions. All speeds include pauses. Table 2 codes Frantzich and Nilsson’s speed as “shortest way with pauses”, whereas the report’s Eq. 3 uses the speed along the actual path, about 1/0.88 of the shortest-way speed (report Fig. 11).
Irritancy. The authors call the selected data sets “non-irritant” (§3.3). Table 2 marks Frantzich and Nilsson and Fridolf et al. (2013, 2014) as “semi-irritant” and Ronchi et al. (2017) as non-irritant, while §4 names Fridolf et al. (2013) and Ronchi et al. (2017) as the experiments with acetic acid. They caution that the recommendation may not be conservative in irritant smoke, where Jin saw speeds drop at visibilities of about 5 m, against below 3 m in non-irritant smoke (§4).
The floor. The 0.2 m/s floor is attributed to Purser and McAllister (2016) (§3.3.2); Ch. 70 gives about 0.3 m/s for walking in darkness (pp. 2285 and 2341).
The three design methods. \(w_{\text{smoke free}}\) is 1 m/s for everyone (method 1, Eq. 3); 1.35, 1.10 or 0.85 m/s for medium, slow and very slow walkers (method 2, Eqs. 4–6); or drawn for each person from a normal distribution with mean 1.35 m/s and SD 0.25 m/s, truncated at 0.85 and 1.85 m/s (method 3, Eq. 7). The authors describe the reduction as absolute, because every person loses the same speed, and fractional, because it starts from each person’s own clear-condition speed (§3.3.3 and §4). Worked example: at 2 m visibility, 1.2 m/s becomes 0.86 m/s and 1.0 m/s becomes 0.66 m/s (§3.3.3).
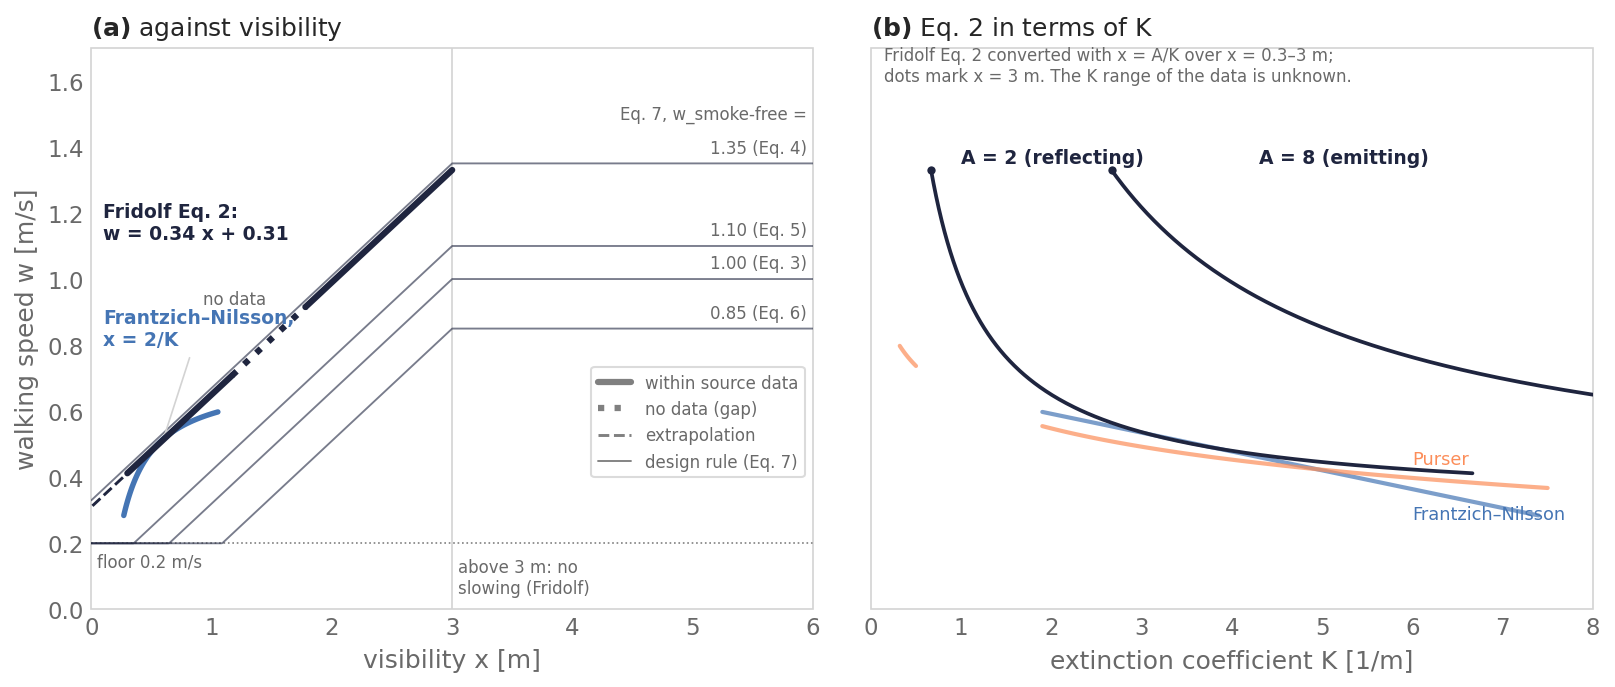
(a) Speed against visibility x [m]: Fridolf Eq. 2 (dark), Eq. 7 design lines (thin), Frantzich–Nilsson with x = 2/K (blue). (b) Eq. 2 converted to K [1/m] with x = A/K (A = 2, 8; Fridolf’s A, not the FDS C) over x = 0.3–3 m, beside Frantzich–Nilsson and Purser. The axis stops at K = 8 1/m, so the A = 8 curve is shown only for x ≥ 1 m (x = 0.3 m would be K ≈ 27 1/m).
Figure provenance
scripts/figures/fundamentals_speed_visibility.py.Known limits
All laws come from volunteers who knew they were in an experiment: short walks by healthy, mostly young adults for Jin (20 m) and Frantzich and Nilsson (37 m), plus longer tunnels and older people in Fridolf et al.’s fit. Only Jin used smoke from fires, and none covers heat. The Jin and Frantzich–Nilsson data should not be combined as one data set, and a relation used outside its measured range is an extrapolation.
Do the sources conflict?
In our assessment, mostly not in their data.
Citation chains. Jin’s primary report (FRI Report No. 42, 1976) settles most apparent conflicts: they come from how later sources cite it. A participant population was taken from another Jin study; the 0.3 m/s “as if in darkness” is Jin’s reference line for walking in darkness, which later sources report as a measurement (our inference for the chain); Purser’s lower range of 0.2 1/m follows Jin’s trend line, not his points; and the smoke, the report’s year and the floor (0.2 or 0.3 m/s) are described in several ways. Details are in the block below.
Different measurements. The experiments differ in smoke, light, speed definition and K range, and their K ranges do not overlap. Each law is consistent with its own data; they part where one is extrapolated into another’s range. The visibility constant also depends on light: Cheung et al. (2026) found σV = 4.7–9.5 for light-emitting signs at 180 lx, close to Jin’s 5–8, but 6–11 at 1–22 lx (§4.4, §6), over signs of up to 22 500 cd/m²; at exit-sign luminances their §4.3 values give about 6–8.4 for seeing the gap of the “C” (our arithmetic). They measured seeing a sign, not walking; our inference is that any law written in x = A/K carries the lighting of its experiments.
The functional form is not established. Linear in K (Frantzich–Nilsson), logarithmic in K (Purser) or linear in x (Fridolf): the data cannot choose, because there are none where the forms differ most (about 1.1–1.9 1/m, and low K), \(R^2\) is only 0.34–0.54, irritancy and low light are confounded in the Frantzich–Nilsson tunnel, and low light also shifts the visibility constant. We read this as not established rather than conflicting.
The assessment in detail
Citation chains. Ronchi et al.’s population of 17 women and 14 men belongs to Jin and Yamada’s 1989 heat-and-smoke study; the walking study had ten men aged 23–37 (FRI Report No. 42, Table 1). Ch. 70’s “has been shown” 0.3 m/s in darkness (pp. 2285, 2341) and Purser’s 2003 floor go back, in our inference, to Jin’s horizontal reference line in report Fig. 2 (p. 17; the report cites Togawa 1969 for a darkness range of 0.3–0.7 m/s, p. 14, and Jin 1978, p. 148, for 0.3 m/s); no non-irritant point in that figure is below about 0.45 m/s. Purser’s stated non-irritant range starts at 0.2 1/m, at the start of Jin’s trend line, while Jin’s points start near 0.5 1/m (our reading of report Fig. 2). The irritant smoke is burning wood cribs in the report and in Jin (1972, 1997), “smoldering wood” in Jin’s 1972 English abstract, non-flaming wood in Purser (2003) and heated wood chippings in Ch. 70. The report is dated September 1976 on its cover; Purser (2003) gives 1975. Jin 1978 runs pp. 135–155; 135–157 in some citations does not match the paper. Fridolf et al. date the walking study 1976, 1978/1997 and 1979, and take a 0.2 m/s floor from Purser and McAllister, who give about 0.3 m/s.
Different measurements. Smoke: smoke from fires, irritant or not, in Jin; cold artificial smoke with 10–15 ppm acetic acid in Frantzich and Nilsson. Light: 0–8 lx in the smoke-filled Frantzich–Nilsson tunnel. Speed: along the corridor for Jin, along the walked path for Frantzich and Nilsson (about 1/0.88 of the shortest-way speed that Fridolf et al. record). K: Jin’s data end near 1.1 1/m and Frantzich and Nilsson’s begin at 1.9 1/m.
Cheung et al. (2026) in more detail
Cheung et al. rebuilt Jin’s 5.5 m chamber (2.4 × 2.4 m cross-section), viewed a light-emitting Landolt “C” through industrial white smoke at 5.5, 10.5 and 15.5 m, and varied the ambient light from 1 to 222 lx (§3). Findings relevant here:
- Jin’s σV range of 5–8 for light-emitting signs refers to 180 lx; at that light they measure 5.3–9.5 at 5.5 and 10.5 m and 4.7–8 at 15.5 m (§4.1, Fig. 8). At 1 lx σV is 7.5–11, and at 22 lx 6–11 (§4.4, Fig. 11), over sign luminances of 128–22 500 cd/m²; at 135–492 cd/m² their §4.3 values give about 6.2–8.4 for seeing the gap of the “C” (our arithmetic; see Visibility through smoke). σV rises with the logarithm of the normalised sign brightness πLₜ/E, so it is constant only for a given brightness.
- At 60 and 22 lx, a sign of the same luminance was seen at about 7 % and 11 % higher extinction in Jin’s data than in theirs (§4.1, §6); the abstract states the direction the other way round.
- The critical extinction coefficient falls by about 40 % for every 5 m added to the viewing distance (§4.3).
- Limits they state: one observer with visual acuity 1.0 who knew the sign’s shape and location, industrial smoke rather than fire smoke, a laboratory sign, and no reflecting signs, so the reflecting range C = 2–4 is not retested (§5).
They identify Jin’s source for the sign experiment as Jin (1970), Visibility through fire smoke (I), with parts II (1971) and III (1972) following; all three are read for Visibility through smoke. FRI Report No. 42 (1976) carries the same English title as “Part 5”, under a different Japanese title (煙中の視程について 第5報).
Sources
- Jin, T. (1972). Visibility through fire smoke (III) [煙中の見透し距離に ついて (III)]. Bulletin of Japanese Association of Fire Science and Engineering, 22(1–2), 11–15. In Japanese with an English abstract. doi:10.11196/kasai.22.11
- Jin, T. (1976). Visibility through fire smoke, Part 5: Allowable smoke density for escape from fire. Report of Fire Research Institute of Japan, 42, 11–18 (Japanese abstract p. 11, English text pp. 12–18). No DOI or public URL. Purser (2003, ref. 7) dates it 1975.
- Jin, T. (1970). Visibility through fire smoke (I). Bulletin of the Fire Prevention Society of Japan, 19(2), 1–8. In Japanese with an English abstract. doi:10.11196/kasai.19.2.1
- Jin, T. (1971). Visibility through fire smoke (II). Bulletin of the Fire Prevention Society of Japan, 21(1), 17–23. In Japanese with an English abstract. doi:10.11196/kasai.21.17 Its English version (our comparison) is Jin (1971), Report of Fire Research Institute of Japan, 33, 31–48 (nrifd.fdma.go.jp), which Jin (1976, ref. 11) cites for V·K ≈ 2. That report does not print the product 2; it gives about (2–4)/σ for placards and says the minimum placard value may be used for walls, doors and stairs (pp. 47–48). Reading that minimum as 2 is our inference.
- Jin, T. (1978). Visibility through fire smoke. Journal of Fire & Flammability, 9, 135–155 (April 1978). English restatement of the walking-speed and allowable-density results (pp. 144–148). No DOI or public URL.
- Togawa, K. (1969). Kenchiku Sekkei Shiryo Shusei, 6, 378. Maruzen. Cited by FRI Report No. 42 (ref. 3, p. 14) for walking in darkness at 0.3–0.7 m/s and by Jin (1978, ref. 19, p. 148) for 0.3 m/s. Not obtained.
- Horiuchi, S., Murozaki, M., & Jin, T. (1974). Abstract, Annual Meeting of the Architectural Institute of Japan (Planning), 581. Source of the group-walking data. Not obtained.
- Jin, T., & Yamada, T. (1985). Irritating effects of fire smoke on visibility. Fire Science and Technology, 5(1), 79–90. doi:10.3210/fst.5.79
- Jin, T., & Yamada, T. (1989). Experimental study of human behavior in smoke filled corridors. Fire Safety Science, 2, 511–519. doi:10.3801/iafss.fss.2-511
- Jin, T. (1997). Studies on human behavior and tenability in fire smoke. Fire Safety Science, 5, 3–21. doi:10.3801/iafss.fss.5-3
- Frantzich, H., & Nilsson, D. (2003). Utrymning genom tät rök: beteende och förflyttning [Evacuation in dense smoke: behaviour and movement]. Report 3126, LUTVDG/TVBB–3126–SE, Department of Fire Safety Engineering, Lund University. lup.lub.lu.se (open access)
- Ronchi, E., Gwynne, S. M. V., Purser, D. A., & Colonna, P. (2013). Representation of the impact of smoke on agent walking speeds in evacuation models. Fire Technology, 49(2), 411–431. doi:10.1007/s10694-012-0280-y
- Fridolf, K., Ronchi, E., Nilsson, D., & Frantzich, H. (2019). The representation of evacuation movement in smoke-filled underground transportation systems. Tunnelling and Underground Space Technology, 90, 28–41. doi:10.1016/j.tust.2019.04.016
- Fridolf, K., Nilsson, D., Frantzich, H., Ronchi, E., & Arias, S. (2018). Walking speed in smoke: representation in life safety verifications. SFPE 2018, extended abstract. No DOI or public URL.
- Purser, D. A. (2003). ASET and RSET: addressing some issues in relation to occupant behaviour and tenability. Fire Safety Science, 7, 91–102. doi:10.3801/IAFSS.FSS.7-91
- Purser, D. A., & McAllister, J. L. (2026). Assessment of hazards to occupants from smoke, toxic gases, and heat. SFPE Handbook of Fire Protection Engineering, 6th ed., Ch. 70, 2271–2352. pp. 2284–2287, 2341; Eq. 70.8, Fig. 70.10, Table 70.3. doi:10.1007/978-3-031-59212-6_70
- Yamada, T., & Akizuki, Y. (2026). Visibility and human behavior in fire smoke. SFPE Handbook of Fire Protection Engineering, 6th ed., Ch. 68, 2201–2224. doi:10.1007/978-3-031-59212-6_68
- Cheung, W. K., Bielawski, J., Arnold, L., Huang, X., & Węgrzyński, W. (2026). Reappraisal of Jin’s visibility through fire smoke experiment: Insights into signage visibility and the impact of ambient light. Fire Safety Journal, 159, 104573. doi:10.1016/j.firesaf.2025.104573
- Korhonen, T. (2021). Fire Dynamics Simulator with Evacuation: FDS+Evac. Technical Reference and User’s Guide (FDS 6.7.6, Evac 2.6.0-draft). VTT Technical Research Centre of Finland. github.com/tkorhon1/FDS-Evac-Guide. Secondary source for the fractional form.
How pyFDS-Evac uses this: see the smoke-speed model.
How it is verified: ISO 20414 Test 18 and the S2 corridor test.