Visibility through smoke
Visibility V [m] is the greatest distance at which an object, typically an exit sign, can still be seen through smoke. Its engineering form, V = C/K, is due to Tadahisa Jin, who measured in the 1970s the smoke density at which a sign in a smoke-filled chamber vanished for an observer outside it. Cheung et al. (2026) rebuilt that chamber and repeated the experiment at lower ambient light. It is the only modern replication we have, and this page follows it where it tests Jin’s law.
Symbols follow the notation table, except that this page writes V for the table’s S, as every source does; L here is ambient light and α a reflectance. The sources use other letters for the same quantities:
| This page | Meaning | Jin 1970–1972 | Jin 1978; Jin and Yamada 1985; SFPE Ch. 68 | Cheung et al. 2026 |
|---|---|---|---|---|
| K [1/m] | extinction coefficient, natural log | σ | \(C_s\) | σ |
| V [m] | visibility at the obscuration threshold | V | V | V |
| C [–] | constant of V = C/K | σ·V | \(C_s \cdot V\) (1978); k in Ch. 68 Eq. 68.8 | K |
| \(B/L\) [–] | sign luminance over ambient light | \(B_{E0}/L\) | \(B_{EO}/L\) with \(L = E/\pi\); \(L_t/(E/\pi)\) | \(\pi L_t/E\) |
| \(\delta_c\) [–] | threshold contrast | \(\delta_c\) | \(\delta_c\) | \(\delta_c\) |
| \(k_s\) [–] | scattering over total extinction | k | k (1978); K (1985); α (Ch. 68) | α |
Jin and Yamada (1985) also use α, and Jin (1978, Eq. A-3, p. 150) ρ, for the reflectance of a placard. Jin 1978 numbers only Eqs. (1), (2), (A-1)–(A-3) and (12); other equations are cited here by page.
Units of sign luminance. 1 asb = 1/π cd/m² (Cheung et al., Eq. 5). The unit is not settled.
- Jin 1970 gives B in asb and uses the illuminance for L; its Fig. 9 plots B/E. In SI this is the ratio \(\pi L_t/E\).
- Jin’s two 1971 papers label the lit signs in asb: Jin (1971, Fig. 1) and Jin (FRI Report 33, 1971, Figs. 3–5 and 13, pp. 36–37 and 45; in English). Both write L = E/π. The Bulletin paper gives L in lm/m²; FRI Report 33 (p. 33) says only that L “has the dimension of the brightness”.
- Jin (1978, Fig. 1, p. 137) prints the same points (our comparison) but labels them 500, 1000 and 2000 cd/m². Jin 1978 gives L = E/π in lm/m² on p. 137 and in cd/m² on p. 149, and writes \(B_{E0} = \rho L\) (Eq. A-3, p. 150).
- Jin and Yamada (1985, Fig. 1) and Jin (2002, Fig. 2-4.2) follow the cd/m² labels of Jin 1978.
So cd/m² first appears in Jin 1978, in the sources we have read. Against this, our arithmetic favours numbers that behave as cd/m² with L = E/π. Take the smouldering 2000 sign at 5.5 m (K ≈ 1.62 1/m, our reading of Fig. 1), \(k_s\) = 1 and L = 80/π. Back-computing \(\delta_c = (B_{E0}/k_s L)\,e^{-KV}\) gives 0.011 if the numbers are cd/m² and 0.003 if they are asb.
- Jin’s Fig. 13 in FRI Report 33 (reprinted as Jin 1978, Fig. B-1) cannot decide the unit. Jin computed it with his Eq. (12) from the smouldering and flaming acrylic data for signs of 200–2000 asb, a superset of Fig. 1 (FRI Report 33, p. 45).
- The only independent value is the photometric 0.010–0.013, measured looking directly at 5.5 m (Jin 1970, Table 1). The cd/m² reading matches it. That comparison crosses smoke (filter paper against acrylic) and light (180 against 80 lx).
Cheung et al. (2026) take the other reading. They state that Jin measured the sign luminance in asb and convert it to cd/m² by dividing by π (§3, p. 5, Eq. 5); Jin’s brightest signs become “about 3000 asb or 955 cd/m²” (p. 4) and his range becomes 36–810 cd/m² (§6, p. 11). They apply this to Jin 1970, the 180 lx data (their ref. [13]), and do not discuss Jin 1978, which prints the same numbers as the 1971 asb labels in cd/m². At most one reading is right: if the 1971 numbers are asb, Jin 1978 and the reviews that copy it overstate the lit-sign luminance by a factor of π; if they are cd/m², the conversion in Cheung et al. makes Jin’s signs π times dimmer than they were.
- The argument also rests on \(k_s\) = 1 for smouldering smoke. That value is a normalisation, not a measurement (see \(k_s\) below), and a factor π in \(k_s\) cannot be told from a factor π in B.
Jin’s experiments
Everything below rests on a short series of papers, all by Jin and all read for this page.
| Paper | Set-up | Range |
|---|---|---|
| Jin 1970, Visibility through fire smoke (I) | Chamber 1.2 × 1.2 × 5.5 m, lit by 24 fluorescent lamps of 10 W, white paint inside; signs viewed from outside through glass; two mirrors extend the path to 10.5 and 15.5 m; white smoke from 5–10 g of filter paper heated to 400 °C at about 10 % O₂; a 1 m light-path densitometer (pp. 3–4, Fig. 3). Lit sign: a circle of 5, 10 or 15 cm projected on frosted glass, sized for the same visual angle at each distance, brightness set by the observer. Placard: circles of four fixed reflectances on a black backing (p. 4). | V = 5.5, 10.5, 15.5 m in this paper; ambient 22, 60, 180 lx; K ≈ 0.3–1.8 1/m for lit signs and about 0.1–0.8 1/m for placards (Figs. 4–10). The number of observers is not stated. |
| Jin 1971, (II) | Same method, smoke from Japanese cedar and plastics, smouldering (white) and flaming (black); measured \(k_s\), \(\delta_c\) and particle sizes. | Lit signs of 500–2000 asb in acrylic smoke at 80 lx (Fig. 1); placards of reflectance 0.13–0.70 in polystyrene smoke at 40 lx (Fig. 2); lit-sign points at about 5.5, 7, 9.1, 12 and 15.5 m, placard points at 5.5, 10.5 and 15.5 m (our reading); \(\delta_c\) at 5.5, 9.1 and 15.5 m (Fig. 8). |
| Jin 1972, (III) | Ten observers aged 23–37 (Table 1; all male according to Jin 1976, p. 12), walked a 20 m smoke-filled corridor towards a commercial lit EXIT sign and marked where they saw it, told its colour and read its letters (Figs. 1–2). Irritant white smoke from tightly packed wood cribs, non-irritant black smoke from kerosene. Corridor at about 80 lx, or a blackout at 0.1–0.5 lx (p. 13). | K ≈ 0.3–1.1 1/m, V ≈ 4–16 m (Figs. 3–5, our reading). Observers waited in a normally lit room first, so the blackout runs were not dark-adapted (p. 12). |
| Jin, FRI Report 33 (1971), Part 2 | English version of Jin 1971: the derivation of the contrast model (pp. 31–34), the apparatus (p. 35, Fig. 2), the same figures (Figs. 5, 6 and 13 are Jin 1971 Figs. 1, 2 and 8; our comparison), \(k_s\) from total scattered flux (pp. 38–39, Tables 1–2) and conclusions (pp. 47–48). “The observer adjusted the brightness of the sign” (p. 35). Above 7 m two mirrors were used and the data “were compensated”, as the threshold contrast through the mirrors is “about 1.7 times as large” (p. 37, footnote). | Critical K at 5.5 m against sign brightness 100–2000 asb at 80 lx for four materials (Figs. 3–4); sign diameters 5, 10 and 15 cm at 5.5, 10.5 and 15.5 m (p. 35). |
| Jin 1978, Visibility through fire smoke (English journal paper) | Summary in English of the papers above and of FRI Reports 40 and 42. Our comparison of what it reprints: the contrast model with its derivation (Eqs. (1)–(2) and Appendix A), which follows FRI Report 33, pp. 31–34, the paper Jin 1978 cites for Appendices A, B and D; the chamber figures (Figs. 1–2 and B-1), identical to Jin 1971 Figs. 1, 2 and 8 and FRI Report 33 Figs. 5, 6 and 13; \(k_s\) (Table C-1), identical to FRI Report 40, Part 4, Table 1; computed red/blue ratios (Table 1, citing Jin 1974, not read); the corridor figures of Jin 1972 (Figs. 6–7); the walking and allowable-density results of FRI Report 42 (Figs. 8–10, Tables 2–3). Jin 1978 does not cite the Bulletin papers of 1970–1972. Not in any earlier paper we have read: the cd/m² labels and the lines KV = 4.5 in Figs. 6–7. | As in the papers it summarises. No observer count and no description of the viewing paths. |
| Jin and Yamada 1985 | Twelve subjects aged 20–30, one woman, read a Landolt ring chart at 4 m in an 18 m² room filled with irritant smoke from smouldering wood chips, wearing sealed ski goggles or, as the comparison “without goggles”, an | |
| unsealed, perforated goggle of the same 65 % transmittance, with noses | ||
| covered by a towel (pp. 82–84). | K ≈ 0–0.7 1/m (Figs. 5–6). |
Jin’s later reviews (Jin and Yamada 1985, §2; Jin 1997, §1.2; Jin 2002, the SFPE Handbook 3rd ed., Ch. 2-4) restate these results and cite Jin (1978) for them. Where Jin 1978 restates an earlier paper, this page cites the earlier paper as the primary and Jin 1978 as the English version.
The contrast model
Jin (1970, pp. 2–3) starts from the contrast between a sign and its background. A sign is seen while its contrast with the background exceeds a threshold \(\delta_c\); smoke both dims the light from the sign and scatters ambient light towards the eye. For a sign much brighter than its background this gives (Jin 1970, Eq. 4; the same in V-form in Jin 1971, Eq. 1)
$$ K\,V \approx \ln\frac{B_{E0}}{\delta_c\, k_s\, L} \qquad \text{(Jin 1970, Eq. 4)} $$with \(B_{E0}\) the sign’s brightness, L the ambient light and \(k_s = \sigma_s/K\) the share of extinction due to scattering. Jin takes \(\delta_c \approx 0.01\) under general lighting and \(k_s \approx 1\) for nearly white smoke (abstract, p. 1). For a placard, \(B_{E0} = \alpha L\) with reflectance α, and L cancels (Eq. 7, p. 6):
$$ K\,V \approx \ln\frac{\alpha}{\delta_c\, k_s} \qquad \text{(Jin 1970, Eq. 7; Jin 1971, Eq. 2)} $$Jin (FRI Report 33, pp. 31–34, Eqs. (1)–(11)), Jin (1978, Eqs. (1)–(2), pp. 136–137, and Appendix A, pp. 148–151, Eqs. (A-1)–(A-3) and the unnumbered equations on pp. 150–151) and Jin and Yamada (1985, Appendix, pp. 88–89) derive the same result in detail. Jin (1978, p. 136) gives \(\delta_c\) = 0.01–0.02 and \(k_s\) = 0.4–1.0. In the placard form L cancels (FRI Report 33, Eq. (10), p. 34; Jin 1978, p. 151). Our reading: light can then act only through \(\delta_c\), which Jin (FRI Report 33, p. 34) says rises “when the light is extraordinarily weak”.
The constants are partly measured and partly assumed:
\(\delta_c\) was measured photometrically only at 180 lx: 0.010–0.013 looking directly and 0.018–0.021 through the two mirrors, at K = 0.8–1.4 1/m (Jin 1970, Table 1, p. 6). Elsewhere it is back-calculated from threshold data through \(\delta_c = (B_{E0}/k_s L)\,e^{-KV}\) with \(k_s\) assumed (Jin 1971, Eq. 3, p. 22): 0.01–0.02 over 5–15 m under usual corridor light, rising steeply when the light falls below about 30–60 lx (Jin 1971, Fig. 8, pp. 22–23; FRI Report 33, Eq. (12) and Fig. 13, pp. 45–46, computed from the acrylic data for signs of 200–2000 asb with the \(k_s\) of acrylic). Jin (1978, Fig. B-1, p. 152) reprints that figure over 20–125 lx at 5.5, 9.1 and 15.5 m: about 0.01 at 5.5 m at all light levels, and at 15.5 m about 0.06 near 30 lx falling to about 0.02 near 120 lx (our reading); the data “can be adopted with the exception of a fire in very dark room or corridor” (p. 151). Jin (1972, Figs. 6–7) gives only relative values of the same kind (p. 14). 0.01–0.05 (Jin and Yamada 1985, p. 80). When observers did not know where the sign was, 0.05–0.10 instead of 0.01–0.02 (Jin 1972, p. 15, citing a 1972 paper of his in the Transactions of the Architectural Institute of Japan, not read).
\(k_s\): 1 for smouldering smoke is assumed, on the reasoning that white smoke hardly absorbs (Jin 1971, p. 19); flaming values are ratios to it, 0.3–1.0, for example 0.3 for kerosene and polyurethane foam and 0.5 for Japanese cedar (Tables 1–2). Jin and Yamada (1985, p. 80) and Jin (1997, p. 5) give 0.4–1.0. The 1971 values come from the total scattered flux measured at 30°–150° with a tungsten lamp; smouldering \(k_s\) was “presumed to be 1.0”, and each flaming value is the ratio of its scattered flux to that of smouldering smoke (FRI Report 33, pp. 38–39). Jin (FRI Report 40, 1975, Part 4, pp. 6–10; Japanese, English abstract p. 10) repeated the measurement at 5°–155° with a He-Ne laser (0.632 µm), at K = 0.2–0.6 1/m, 5–10 minutes after generation, as means of 6–10 runs (p. 7). Our translation of pp. 6–7: \(k_s\) is taken as 1 for wood smouldering at 350 °C, and each other value is the ratio of the integrated angular scattering to that reference. Its Table 1 (p. 9) is reprinted as Jin (1978, Table C-1, p. 154):
- smouldering: 1.0 for wood and acrylic resin, 0.9 for polystyrene and polyvinyl chloride foam;
- flaming: 0.4 for wood and kerosene (the latter in parentheses), 0.5 for polystyrene and polyvinyl chloride foam, 0.6 for acrylic resin.
Against FRI Report 33 Table 1, flaming wood (cedar) falls from 0.5 to 0.4, polystyrene rises from 0.4 to 0.5, acrylic from 0.5 to 0.6 and kerosene from 0.3 to 0.4; polyvinyl chloride stays at 0.5. The summary “nearly equal to 1.0 for smoldering smoke and about 0.5 for flaming smoke” (Jin 1978, p. 151; FRI Report 40, p. 10) repeats FRI Report 33 (p. 39). Our reading: smouldering \(k_s\) = 1 remains a normalisation. Because \(k_s\) sits inside the logarithm, 0.4–1.0 changes KV by ln 2.5 ≈ 0.9 and 0.3–1.0 by ln 3.3 ≈ 1.2 (our arithmetic).
Jin found that the measured critical K at 5.5 m rose linearly with the logarithm of sign brightness at each ambient light (Jin 1970, Figs. 4–5, p. 4), and that plotting against \(B_{E0}/L\) collapsed the three light levels onto one line (Fig. 6, p. 5). At 180 lx, the data at all three distances followed the theoretical curve with \(\delta_c = 0.01\) and \(k_s = 1\) (Fig. 11, p. 7; the figure shows only 180 lx). Jin (1970, p. 4) recorded the sign brightness and the change of chamber illuminance during each run; lit-sign runs reproduced within about three repeats, placards needed more than ten.
From the model to V = C/K
If the sign, the ambient light and the smoke are fixed, the right-hand side of Eq. 4 is a constant (Jin 1970, Eq. 5, p. 5):
$$ V = \frac{C}{K} $$The ranges. Jin (1970, abstract, p. 1) gives the visibility of the placard as about (2–4)/K and of the lit sign as about (5–10)/K. Jin (FRI Report 33, p. 47) gives the same ranges as conclusions for 5–15 m, and Jin (1978, p. 138) restates them and attributes them to its Figs. 1 and 2, the 80 lx lit-sign and 40 lx placard data. Our reading: those figures’ points span KV ≈ 6.7–9.9 and 1.4–4.0, so the ends 5 and 2 do not come from them alone. The ends are partly estimates. Our translation of Jin (1970, p. 7): from Fig. 11, \(B_{E0}/L = 1\) gives KV ≈ 4.5; a placard of reflectance 1 is hard to make, so the best real placard reaches about 4; a lit sign can in theory reach any value by a brighter lamp, but in practice perhaps 10 at most. The measured placard lines are KV = 4.0, 3.1 and 2.2 for reflectances of 60, 30 and 14 % on a 7 % background at 180 lx (Fig. 10, p. 6). Jin and Yamada (1985, p. 81), Jin (1997, Eqs. 3–4, p. 6) and Jin (2002, Eqs. 3–4, p. 2-43) repeat the ranges; Yamada and Akizuki (2026, SFPE Handbook 6th ed., Ch. 68, Eqs. 68.8–68.10, p. 2208) reproduce them.
The range of validity. Jin (1971, abstract p. 17 and p. 18; in English FRI Report 33, p. 38, and Jin 1978, p. 137) states that KV is almost constant for visibilities of 5–15 m, in white and in black smoke, for lit signs and placards; strictly, KV falls slightly as the distance grows, which he attributes to \(\delta_c\) rising with distance (Jin 1971, p. 22, our translation). Jin (1970, p. 5) states that Eq. 5 holds for lit signs at least over 5.5–15.5 m, his chamber distances.
C = 8 and C = 3. Jin (1971) draws, not fits, the line KV = 8.0 through lit signs of 500–2000 (asb in Jin 1971, cd/m² in Jin 1978; see the units note above) in acrylic smoke at 80 lx, flaming and smouldering, with points spread over KV ≈ 6.7–9.9 (Fig. 1), and KV = 3.0 through placards of reflectance 0.13–0.70 in polystyrene smoke at 40 lx, with points over KV ≈ 1.4–4.0 (Fig. 2; spreads our reading). Jin (1978, Figs. 1–2, pp. 137–138) reprints both figures with the same points and lines, labelled “Light in corridor 80 lx” and “40 lx”, without the smoke materials; its Fig. 2 axis stops near 0.17 1/m, so the two lowest placard points of Jin 1971 (reflectance 0.13 at 15.5 m, K ≈ 0.12–0.13 1/m) are not shown (our comparison). Jin (1978, p. 137) states that the signs were observed from outside the smoke-filled chamber through a glass window; FRI Report 33 (p. 48) adds that the observer was therefore “free from the influence of the lachrymatic and irritant effect”. Mulholland (2002, SFPE Handbook 3rd ed., Ch. 2-13, Eqs. 14–15 and Fig. 2-13.5, p. 2-265) gives KS = 8 for a light-emitting and KS = 3 for a light-reflecting sign, citing Jin (1978). His figure’s range bars “include data for both flame- and smolder-generated smoke and sign illumination levels varying by about a factor of 4”, and he notes that the subjects viewed the smoke through glass, so irritation was excluded. Our comparison: his bars are broadly consistent with Jin’s Figs. 1–2, not identical: at 5.5 and 12 m his upper ends lie about 0.1 1/m above Jin’s highest point, and he places the 12 m bar near 12.6 m. Lit-sign bars (K in 1/m, his then Jin’s): 1.45–1.90 against 1.41–1.78 at 5.5 m; 0.99–1.32 against 1.0–1.33 at 7 m; 0.80–1.03 against 0.83–1.0 at 9 m; 0.59–0.79 against 0.55–0.70 at 12 m; 0.42–0.55 against 0.40–0.56 at 15.5 m. Placard bars: 0.25–0.70 against 0.27–0.70 at 5.5 m; 0.19–0.39 against 0.17–0.38 at 10.5 m; 0.19–0.27 against 0.17–0.26 at 15.5 m. The placard lower edges at 10.5 and 15.5 m exclude Jin’s lowest points in both prints, so the bars cannot show which print he used. In our reading, his “factor of 4” is the 500–2000 of the lit signs; the placard reflectances span a factor of about 5.4. So the drawn constants C = 8 and 3 trace to Jin’s 80 lx and 40 lx data (Jin 1971 and FRI Report 33, reprinted in Jin 1978), not to the 180 lx data of Jin 1970. The FDS User’s Guide takes C = 8 and 3 from Mulholland (see How FDS uses it).
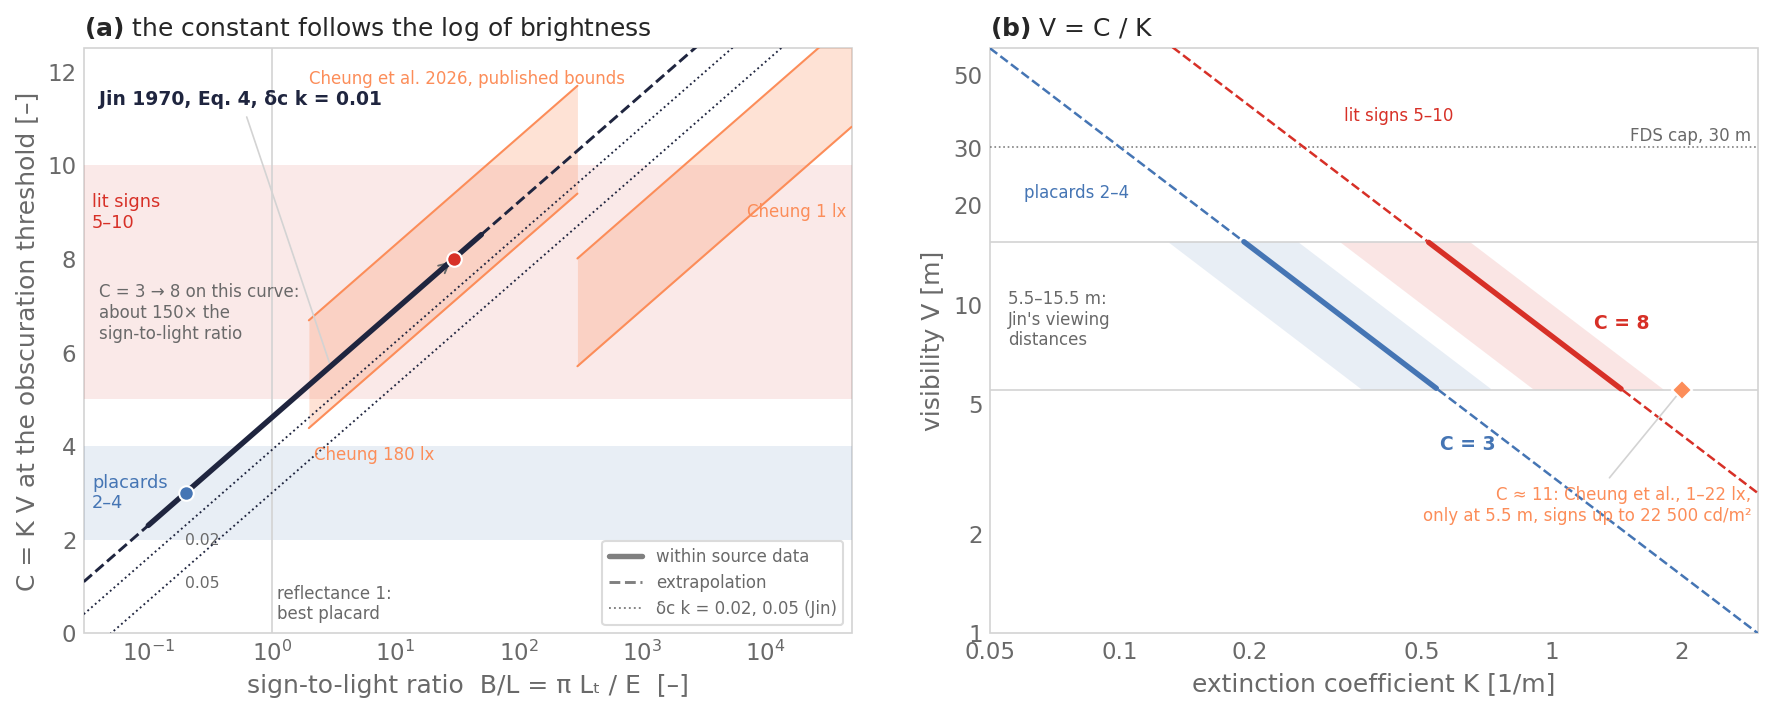
(a) Jin’s Eq. 4 with \(\delta_c k_s\) = 0.01 (solid over the 0.1–50 range
of his Fig. 11), and 0.02 and 0.05 (dotted). C is the logarithm of a
brightness ratio: going from C = 3 to C = 8 needs about \(e^5\) ≈ 150
times the sign-to-light ratio (our arithmetic). Shaded: the bounding
curves Cheung et al. publish in their Fig. 11 at 180 lx (\(\delta_c k_s\) =
0.0025–0.025) and 1 lx (0.1–1), over the extent of their data there (our
reading of the axes). In our reading the 1 lx data sit below Jin’s curve:
the higher C in dim light comes from the larger ratio for the same sign,
not from a shift of the curve. The points for C = 3 and 8 on the 0.01
curve are our construction, not where Jin’s 1971/1978 data sit. (b) V = C/K for
C = 3 and 8; solid over 5.5–15.5 m, Jin’s viewing distances, dashed
outside; shading: Jin’s bands 2–4 and 5–10. Cheung et al.’s top value
C ≈ 11 was reached only at 5.5 m and with signs far brighter than exit
signs (marked by a point). Script: scripts/figures/fundamentals_visibility_constant.py.
Reflecting signs and ambient light: the sources differ in emphasis. Jin (1970, p. 6, our translation) concludes from Eq. 7 that in white smoke the threshold density of a placard does not depend on the ambient light, and finds almost no effect between 60 and 180 lx, but a lower threshold at 22 lx, the lowest level tested, which he calls extremely dark and attributes to a change in \(\delta_c\) (p. 7, Fig. 9). Jin (1971, p. 18) says the same, “except when the light is extremely weak” (our translation). The English texts say instead that the product for reflecting signs “depends mainly on the brightness of the sign and the brightness of illuminating light” (Jin 1978, p. 137, the earliest print of this wording we have) or “on the reflectance of the sign and the brightness of illuminating light” (Jin and Yamada 1985, p. 81; Jin 1997, p. 6; Jin 2002, p. 2-43; Ch. 68, p. 2208). Jin (1971, Fig. 8) shows \(\delta_c\) rising steeply below about 30–60 lx. In our reading, the light matters at 22 lx and below, which covers all emergency-lighting levels (1–15 lx), so the reviews’ wording is compatible with the primaries: the primaries stress reflectance, the reviews add the light.
Black and white smoke. At the same K, a lit sign was seen somewhat farther in black (flaming) smoke than in white (smouldering) smoke (Jin 1971, p. 18 and Fig. 1; Jin and Yamada 1985, p. 81). Jin (1997, p. 5) notes that black smoke has the smaller \(k_s\) and that, because \(k_s\) sits inside the logarithm, the difference has little effect on visibility. Our inference: a smaller \(k_s\) gives a larger KV in Eq. 4, the direction observed.
Walls, floors and doors. Jin (1978, p. 138), Jin and Yamada (1985, p. 81), Jin (1997, p. 7) and Jin (2002, p. 2-43) state that the visibility of walls, floors, doors and stairs depends on the surroundings, “however, the minimum value for reflecting signs may be applicable”, that is, C ≈ 2 in our reading. Jin (1976, p. 17) uses “Visibility (m) × Extinction coefficient (1/m) ≈ 2” to turn a required visibility into an allowable smoke density, citing Jin’s 1971 FRI Report 33 (not read). Jin (1978, Table 3, p. 147) prints the same table, “where \(C_s \cdot V\) = 2”, under a section heading that cites FRI Report 42 but without citing FRI Report 33 for the rule: 3–5 m and 0.4–0.7 1/m for people familiar with the building, 15–20 m and 0.1 1/m for strangers. Jin (2002, Table 2-4.2) pairs 13 m with 0.15 1/m and 4 m with 0.5 1/m; our arithmetic: both products are about 2. For whom each pair is meant, see Familiar and unfamiliar occupants.
What C is. Eq. 4 makes C a property of the sign, its lighting and the smoke, through \(B_{E0}/L\), \(\delta_c\) and \(k_s\). Our inference: C should be chosen from the type of sign and the light, not fitted to a desired outcome.
Cheung et al. (2026): the reappraisal
Cheung, Bielawski, Arnold, Huang and Węgrzyński rebuilt Jin’s chamber at 5.5 m length with a larger 2.4 × 2.4 m cross-section, three mirrors for 5.5, 10.5 and 15.5 m, a lab-made LED sign box showing a Landolt “C” of 5, 10 or 15 cm, industrial white smoke (mineral oil, Concept Smoke Vulcan 5000), a 1 m densitometer with a 638 nm laser (§3, Table 1), and ambient light from 222 lx down to 1 lx (§4.2, Fig. 9). The observer raised the sign luminance until the “O” shape, and then the gap of the “C”, was barely visible; each set was repeated twice (§3). They also replotted Jin’s (1970) data in SI units (§4.1).
What they confirm:
- The critical K rises linearly with the logarithm of sign luminance, and plotting against \(\pi L_t/E\) collapses the light levels onto one line (§4.1, Figs. 5–6; \(R^2\) = 0.96–0.99).
- The constants that FDS uses (C = 8 and 3) trace to Jin’s 80 lx and 40 lx data (Jin 1971 and 1978, Figs. 1–2, via Mulholland 2002), not to the 180 lx data behind Cheung et al.’s “Jin’s 5–8”.
- At 180 lx, KV is comparable: 5–8 in Jin’s data, 4.7–9.5 in theirs (abstract; §6). By distance, 5.3–9.5 at 5.5 and 10.5 m and 4.7–8 at 15.5 m (§4.1, Fig. 8).
- At 15.5 m their data agree with Jin’s (§4.1, Fig. 7).
What they revise:
- Ambient light. In dim light a sign of the same luminance stays visible in denser smoke. KV is 7.5–11 at 1 lx and 6–11 at 22 lx (§4.4, Fig. 11), against 5–8 at 180 lx. These ranges pool the “O” and “C” thresholds (Fig. 11), and in our inference span sign luminances up to the study’s maximum of 22 500 cd/m² (§4.1 gives 128–22 500 cd/m² as the study’s overall range). At luminances of ordinary exit signs their printed values give lower constants for seeing the gap of the “C” (§4.3; these are the lowest filled “C” markers of Fig. 10; our arithmetic): at 1 lx, K = 1.5, 0.8 and 0.5 1/m at 189, 202 and 492 cd/m² for 5.5, 10.5 and 15.5 m, so KV ≈ 8.3, 8.4 and 7.8; at 22 lx, K = 1.4, 0.7 and 0.4 1/m at 224, 135 and 220 cd/m², so KV ≈ 7.7, 7.4 and 6.2. Jin’s criterion is the “O”, which is reached at lower luminance (for example about 127 against 191 cd/m² at 1 lx and 5.5 m, our reading of Fig. 10a), so constants for the “O” would be somewhat higher. At 5.5 m the critical K is about 1.5 1/m at 1 lx and 0.9 1/m at 222 lx (§4.2), so KV ≈ 8.3 against 5.0; in our reading of Fig. 9a both are near 130 cd/m², the first an “O” and the second a “C” point. They write that using KV = 5 “may result in overestimation” and that “the actual visibility of the illuminated signage should be higher” (§4.4). In our reading, KV = 5 understates the visibility of a lit sign in dim light. Jin’s 5–8 refers to 180 lx (Fig. 8), while emergency lighting codes require only 1–15 lx (§4.2).
- Jin’s assumptions. Their data do not follow Jin’s curve with \(\delta_c = 0.01\) and \(k_s = 1\): \(k_s\) may be below 1, and \(\delta_c\) may vary with the light and the sign luminance (§4.1, §4.4). Their Fig. 11 draws bounding curves with \(\delta_c k_s\) = 0.1–1 at 1 lx, 0.0125–0.125 at 22 lx, 0.005–0.05 at 60 lx and 0.0025–0.025 at 180 lx.
- Jin’s sign luminance. They state that Jin’s lit signs, about 3000 asb (955 cd/m²), were much brighter than common exit signs, which is why they were seen at K up to 1.8 1/m (§2). They also give Jin’s range as 42–808 cd/m² (§4.1) or 36–810 cd/m² (§5), and common exit signs as about 100–500 cd/m² (§4.1) or 100–300 cd/m² (§5); in our reading these ranges overlap.
- Distance. At 5.5 and 10.5 m their critical K is about 20 % higher than Jin’s at the lowest \(\pi L_t/E\) (§4.1). The critical K falls by nearly 40 % per 5 m of distance (§4.3). Our arithmetic: a constant KV alone predicts a fall of 48 % from 5.5 to 10.5 m and 32 % from 10.5 to 15.5 m.
The gaps they found in Jin’s work: it is not stated how Jin measured the ambient light and the sign luminance, or where the densitometer was; Jin’s Figs. 5 and 6, and Figs. 5 and 7 at 5.5 m, do not match; and it is unclear how the 10.5 m path was obtained (§4.1, §5). The sign size grew with distance to keep the visual angle, so the law says nothing about a fixed sign seen from farther away; they leave this to future work (§2, issue III).
The limits they state (§5): one observer with visual acuity 1.0 who knew the sign’s shape, size and place; industrial white smoke, not smouldering or sooty fire smoke; a laboratory Landolt “C”, not a real exit sign; no reflecting signs. The reflecting range 2–4 is therefore untested by them, and so are black smoke and irritants.
Our notes as readers:
- On the direction of the 7–11 % difference, the abstract says their critical K is higher than Jin’s. §4.1 and §6 say that Jin’s is higher.
- They call \(\pi L_t/E\) not dimensionless, with units cd/m²·lx (§4.1). In SI, lx = cd·sr/m², so the ratio is dimensionless.
- Jin (1970, pp. 4–6 and Table 1) does describe two mirrors for 10.5 and 15.5 m, a luminance meter built from a single-lens reflex camera for \(\delta_c\), and a correction of +0.5 to KV for the contrast lost in the mirrors. Whether the replotted 10.5 and 15.5 m points include that correction is not stated. Jin (1970, p. 4) also states that the sign brightness and the chamber illuminance were recorded during each run, and (p. 6) that the illuminance stayed nearly constant in white smoke, which answers part of their “not mentioned”. Jin (1970, p. 5) says the two mirrors give 10.5 and 15.5 m, but his Fig. 3 shows only the 15.5 m path, so their doubt about 10.5 m stands. Jin (1971 and 1978, Fig. 1) also has lit-sign points at about 7, 9.1 and 12 m, and Jin (1971, Fig. 8; 1978, Fig. B-1) a distance of 9.1 m, so later runs used more paths than Jin 1970 describes (our reading). Jin (FRI Report 33, p. 37, footnote) states that two mirrors were used above 7 m and that those data were compensated because the threshold contrast through the mirrors is about 1.7 times as large. Our arithmetic: ln 1.7 ≈ 0.53, the +0.5 of Jin (1970, Table 1), and 0.020/0.012 ≈ 1.7 from the same table. So Jin’s 1971 lit-sign points beyond 7 m are already corrected; whether the Jin 1970 points replotted by Cheung et al. are is still not stated. How the 10.5 m path was built is still not described.
- Their text says the contrast ratio is lower in dimmer light (§4.4). Their Fig. 11 bounds give a larger \(\delta_c k_s\) at 1 lx than at 180 lx, as does Jin (1971, Fig. 8), where \(\delta_c\) rises as the light falls.
- In their Fig. 11 the dim-light data lie below Jin’s curve at the same \(\pi L_t/E\), except the 22 lx data at low ratios, which straddle it. The larger KV in dim light comes from the larger \(\pi L_t/E\) of the same sign when E is small, not from a sign being seen better than Jin’s model predicts.
Other data on real exit signs
Yamada and Akizuki (2026, Ch. 68, pp. 2208–2210) report experiments by Yamada, Kubota, Abe and Iida (2004), which we have not read, on three Japanese exit signs of 250–800 cd/m² in non-irritant white smoke without background light (Table 68.2). The fitted slopes of V against 1/K are 9.1, 12.6 and 22.5 (\(R^2\) = 0.93–0.94, Fig. 68.15); they attribute the 22.5 of the medium square sign to its size (“twice as visible as others due to size effect”, p. 2209). With background light, the small square sign’s slope falls from 12.6 to 5.1 (\(R^2\) = 0.92, Fig. 68.15, p. 2210). A rectangular lit exit sign was lost at about 10 m, a small square one at about 13 m, at K = 1.0 1/m, and they note that the constant “tends to be somewhat larger” than Jin’s (p. 2209). Our inference: larger constants without background light, and the smaller slope in the lit area, agree in direction with Cheung et al.’s low-light results.
Jin (FRI Report 40, 1975, Part 3, pp. 1–5; Japanese, English abstract p. 5) measured a xenon flashing sign in the same chamber. KV rose linearly with the logarithm of the condenser capacity (40–340 µF). In our reading of Fig. 4 it was about 4.2–8.2 at 180 lx and about 8.3–11.6 at 0.1 lx, in white and black smoke. Jin considers KV ≈ 15 about the practical limit (p. 3, our translation). A flashing sign needed about 1/10 of the luminous energy of a fixed sign for the same visibility (abstract).
Seeing a sign versus reading it
All of the above is the obscuration threshold: the point where a sign is barely seen. Jin (1970, p. 7) judged only whether the sign was there and noted that reading its content depends on size and form.
Jin (1972). In the corridor, seeing the sign followed KV ≈ constant in both irritant and non-irritant smoke. Telling its colour or reading its letters did so only in thin smoke: in the irritant smoke, the visibility fell sharply above some density (p. 13, Figs. 3–5). At K = 0.5 1/m it fell “by more than 30 %” compared with non-irritant smoke of the same density (English abstract, p. 11), and to “a fraction” (数分の1, p. 14, our translation). Jin attributes this to tears and irritation, which raise the contrast needed (Figs. 6–7, pp. 14–15). Even in thin, weakly irritant smoke, the letters of a commercial exit sign needed a contrast 3–5 times that for seeing the sign (p. 15). Normal lighting and the blackout gave almost the same visibility (p. 15). Jin (1972, p. 15) concludes that the obscuration contrast is little affected by irritation, so the chamber values apply to seeing a sign whose location is known; not knowing the location matters more (\(\delta_c\) 0.05–0.10). Cheung et al. (2026, §4.2, Fig. 9a) give a modern data point for the same distinction: at 1 lx and K = 1.6 1/m, 170 cd/m² sufficed to see the “O” and 440 cd/m² to see the gap of the “C”.
Jin (1978, Figs. 6–7, pp. 143–144, citing Jin 1972) reprints the obscuration and letter-reading data and adds a drawn line \(C_s \cdot V\) = 4.5 to both; the text states only “\(C_s \cdot V\) ≅ constant” for seeing the sign and that for reading the words “this relation can only apply to a low smoke density” (p. 143). Our reading of Fig. 6: the line runs along the lower edge of the obscuration points (irritant, K ≈ 0.31–0.51 1/m, KV ≈ 4.6–6; non-irritant, K ≈ 0.5–1.1 1/m, KV ≈ 5–10), so 4.5 is not a fitted constant. Jin (1978, p. 144) adds that “the irritation of smoke has little effect on the contrast threshold even in the thick smoke” for seeing a sign.
Our caveats: the irritant smoke was white and the non-irritant smoke black, so irritancy and smoke colour change together; Jin (1972, p. 14) notes that white smoke scatters more corridor light, but finds the differences larger than that alone. The blackout changed the corridor light and the sign’s own lamps together (p. 13).
Jin and Yamada (1985). Visual acuity with the unsealed goggle, relative to that with the sealed one, stayed almost constant below K = 0.25 1/m and fell rapidly above it (Fig. 6, p. 85); the ratios near 1 were measured at K ≈ 0–0.24 1/m. They fitted, for K ≥ 0.25 1/m,
$$ S = 0.133 - 1.47 \log K \qquad \text{(Jin and Yamada 1985, Eq. 3)} $$and wrote the legibility distance as
$$ \begin{aligned} V_1 &= \frac{C}{K}, \quad 0.1 \le K < 0.25,\\ V_2 &= \frac{C}{K}\,(0.133 - 1.47 \log K), \quad K \ge 0.25 \end{aligned} \qquad \text{(Eqs. 4–5)} $$with C = 6 matching the corridor data for reading the words of an exit sign (p. 87, Fig. 2). The equations do not hold for K < 0.1 1/m or where \(V_2 < 0\) (p. 86). Jin (1997, Eqs. 5–7, pp. 8–9) and Jin (2002, Eqs. 5–7, p. 2-45) repeat them. The log is base 10: the drawn line in Fig. 8 falls about 1.4 per decade, and S(0.25) = 1.02 is continuous with V₁. Our reading: S is the ratio of Fig. 6, fitted to five points at K ≈ 0.24–0.55 1/m (Fig. 8); the point near 0.32 1/m is 0.96 in Fig. 8 but 0.90 in Fig. 6. The non-irritant legibility points scatter around C = 6, with KV ≈ 3.8–7.8 (Fig. 2, our reading). They also found that with the eye blink rate 1.5–2.0 times normal, acuity fell rapidly, and above 2.0 “presumably nothing can be seen beyond 4 m” (p. 86).
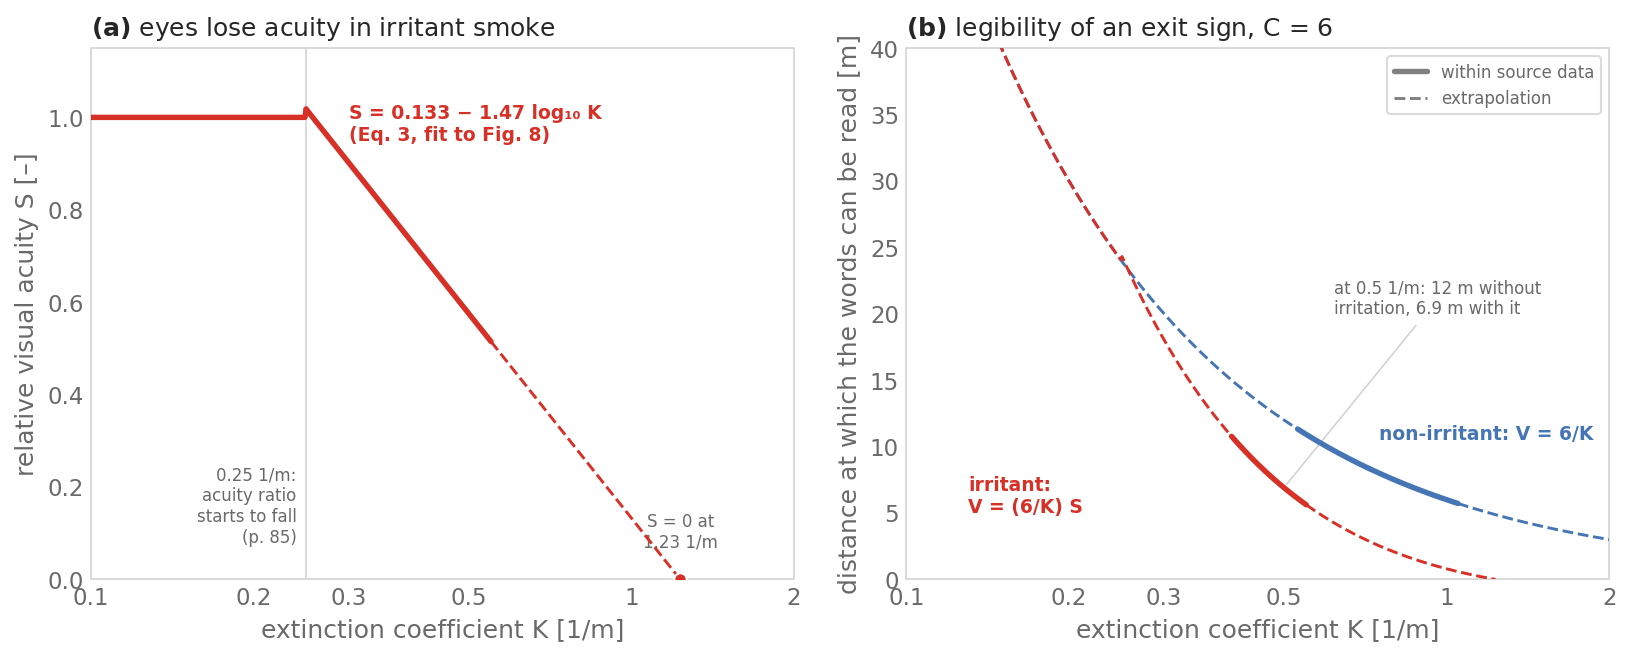
Jin and Yamada (1985), Eqs. 3–5 with C = 6. Solid over the data, as we
read their Figs. 2, 6 and 8 and Jin (1972, Fig. 5): acuity ratios at
0.1–0.55 1/m, non-irritant legibility points at about 0.53–1.05 1/m,
irritant legibility points at about 0.40–0.55 1/m; dashed outside. At K = 0.5 1/m the irritant law
gives 6.9 m against 12 m (our arithmetic). S reaches zero at K ≈ 1.23 1/m.
Script: scripts/figures/fundamentals_visibility_irritant.py.
The 0.5 1/m for open eyes. Jin (1978, p. 144), for the corridor data at K ≈ 0.3–0.5 1/m (Fig. 7, our reading), and Jin and Yamada (1985, p. 81) write that in thick irritant smoke “the subjects could not keep their eyes open for a long time”, without a number. Jin (1978, p. 142) elsewhere writes “If we assume that the smoke density at which fire escape action could be done is 0.5/m”, as an assumption for judging spectral effects, citing Moriya and Watanabe (1967) for the 10 minutes, not for the 0.5. Yamada and Akizuki (2026, Ch. 68, p. 2211) put it “under 0.5 [1/m]” and, two sentences later, “over 0.5 [1/m]”. We found no primary source for 0.5 1/m as a limit for keeping the eyes open. Possible origins, not established: Jin (1972, abstract) uses 0.5 1/m as its example of dense irritant smoke; Jin (1997, pp. 10–11), summarising Jin (1981), sets 0.5 1/m as the allowable density for familiar occupants, where most of the Fire Research Institute researchers among his subjects began to lose their steadiness (see Familiar and unfamiliar occupants); Jin (1978, p. 142) and Jin (2002, p. 2-45) assume escape is still possible at 0.5 1/m; and in Jin and Yamada (1985, Fig. 6) a dashed construction meets the acuity curve near 0.53 1/m.
Colour of the sign. Jin (1978, Table 1, p. 142, citing Jin 1974, not read) gives the ratio of the visibility of a red to a blue lit sign of the same luminance as 1.2–1.4 in smouldering and 1.2–1.3 in flaming smoke, 10 minutes after generation at an initial K of about 0.5 1/m. The ratios are computed, not observed: \(V_\text{red}/V_\text{blue} = K_\text{blue}/K_\text{red}\) (unnumbered equation, p. 142) from measured spectral extinction at 657 and 483 nm, assuming equal luminance and equal \(\delta_c\) for both colours (p. 142). Jin concludes that visibility “varies by only tens of percent at the most with differences in color of lights of the same brightness” (abstract, p. 135).
Familiar and unfamiliar occupants
Jin derived two allowable smoke densities for escape: K = 0.5 1/m (visibility about 4 m) for people familiar with the building and K = 0.15 1/m (about 13 m) for people unfamiliar with it (Yamada and Akizuki 2026, Table 68.3, p. 2215; Jin 1997, §2.1 and Table 1, p. 11; Jin 2002, Table 2-4.2, p. 2-47). Jin (1997, pp. 10–11), summarising Jin (1981), places 0.15 1/m where most of the subjects from the general public, taken as unfamiliar occupants, began to feel uneasy, and 0.5 1/m where researchers of the Fire Research Institute, taken as familiar occupants, began to lose their steadiness. Strangers need to see farther, so they get the lower density.
The SFPE Handbook gives the pair both ways. The visibility chapter (Yamada and Akizuki 2026, 2016; Jin 2002) follows Jin. The hazard chapter (Purser 2002; Purser and McAllister 2016, 2026) cites the same Jin (1981) paper but assigns 0.15 1/m (OD/m 0.06) to familiar and 0.5 1/m (OD/m 0.2) to unfamiliar occupants, in three editions. In the table, Purser’s values are in bold.
| Source | Familiar | Unfamiliar | Where |
|---|---|---|---|
| Yamada and Akizuki 2026, SFPE 6th ed., Ch. 68 | 0.5 1/m (4 m) | 0.15 1/m (13 m) | Table 68.3, p. 2215 |
| Purser and McAllister 2026, SFPE 6th ed., Ch. 70 | 0.15 1/m | 0.5 1/m | p. 2285 |
| Yamada and Akizuki 2016, SFPE 5th ed., Ch. 61 | 0.5 1/m (4 m) | 0.15 1/m (13 m) | Table 61.3, p. 2198 |
| Purser and McAllister 2016, SFPE 5th ed., Ch. 63 | 0.15 1/m | 0.5 1/m | p. 2338 |
| Jin 2002, SFPE 3rd ed., Ch. 2-4 | 0.5 1/m (4 m) | 0.15 1/m (13 m) | Table 2-4.2, p. 2-47 |
| Purser 2002, SFPE 3rd ed., Ch. 2-6 | 0.15 1/m | 0.5 1/m | p. 2-118 |
| Jin 1997, Fire Safety Science 5 | 0.5 1/m (4 m) | 0.15 1/m (13 m) | Table 1, p. 11 |
We read Purser’s labels as swapped, for four reasons:
- Both chapters cite Jin (1981) for the same two numbers.
- Purser’s own preceding sentence says that less stringent limits may suit small spaces if occupants are familiar with the building, and more stringent ones large spaces, particularly if occupants are unfamiliar and need to see farther (2026, p. 2285; 2016, p. 2338; 2002, p. 2-118). That is the direction of Jin’s assignment.
- Purser’s Table 70.3 (2026, p. 2284) suggests OD/m 0.2 (about 5 m) for small enclosures and short travel distances and OD/m 0.08 (about 10 m) for large ones. The direction agrees with Jin; the numbers are a different pair.
- Jin’s earlier rule (1976), built from minimum visibilities and walking speed, also allows familiar occupants the denser smoke (see “Allowable smoke density” in the block “Jin’s data: sources, ranges, darkness and participants” on Walking speed in smoke).
Jin (1981) itself confirms this assignment: 0.15 1/m for occupants unfamiliar with the building, 0.5 1/m for familiar ones (Table 2, p. 139; Conclusion, p. 141).
The thresholds come from one Japanese experiment, reported in 1981, with 49 subjects, 24 Fire Research Institute researchers and 25 members of the public, who sat at a steadiness tester and then walked about 10 m and back, in white wood smoke that irritated their eyes and throats (Jin 1981, pp. 130–132; Jin 1997, pp. 9–10; Jin 2002, p. 2-46). They mark the onset of unease or unsteadiness. They are not incapacitation data.
No pyFDS-Evac default applies these limits by familiarity. Familiarity in pyFDS-Evac sets
which exits an agent knows, its cognitive map (see
Wayfinding and
Familiarity). It does not change
how much smoke the agent tolerates. Jin’s familiarity is a different
thing: all his subjects could see the exit of the test room, and the two
groups also differed in sex. The researchers said the smoke did not
scare them because the pre-test briefing had called it harmless (Jin
1981, pp. 131, 139 and 141–142). The opt-in additive routing model
counts a segment as not visible at or above
visibility_extinction_threshold = 0.5 1/m
(RouteCostConfig in pyfds_evac/core/route_graph.py). The value equals
Jin’s familiar limit, but it applies to all agents, has no recorded source, and is listed as an
uncalibrated pyFDS-Evac assumption in Routing.
If you read these sources differently, please open a documentation issue and name the primary source and page.
Known limits
- The law describes a straight, unobstructed line of sight through uniform smoke to one object. It does not describe how far one can see around corners, or how much smoke a person walks through. In Wood’s survey of 952 UK fires (2193 people interviewed at the scene), 60 % of the people in incidents with smoke attempted to move through it, and 26 % of those who did turned back. Of those who turned back, 91 % estimated they could see 4 yd (3.7 m) or less; visibility was self-estimated on a scale of 0, 2, 4, 10, 12, 15, 20 and 20+ yd (Wood 1972, Fig. 6, p. 50). The distance they moved correlated only imperfectly with the distance they could see ahead (Spearman ρ = 0.41; Wood 1972, p. 84), and moving through smoke was not associated with leaving the building (Wood 1980, p. 91).
- It was measured at 5.5–15.5 m (Jin 1970, 1971) and stated for 5–15 m (Jin 1971; Jin 1978, p. 137). V outside that range, including the 30 m FDS cap, is an extrapolation.
- The sign grew with distance to keep its visual angle (Jin 1970, p. 3; Cheung et al., §2), so a real sign of fixed size is covered only partly: Jin (1970, Fig. 12) found the critical K of a placard at 10 m rising from about 0.2 to 0.4 1/m with size and saturating above a visual angle of about 0.45° (our reading), and Ch. 68 (p. 2209) attributes the medium square sign’s larger slope to its size.
- C depends on the sign’s luminance, the ambient light and the smoke. Jin’s lit-sign values are for 22–180 lx. In 1–22 lx, Cheung et al. measured 6–11 over signs up to 22 500 cd/m², and about 6–8.4 at exit-sign luminances for seeing the gap of the “C” (our arithmetic from their §4.3).
- It is a threshold for seeing a sign, not for reading or understanding it. Reading needs more contrast (Jin 1972, p. 15), and in irritant smoke the distance drops faster than 1/K (Jin and Yamada 1985).
- Jin (1970, pp. 7–8, our translation) expected real visibility to be lower than in his chamber: the signs were viewed through glass, so the results strictly apply to people wearing smoke masks with eye protection; the observers knew where the sign was; and physiological and psychological effects were absent. Cheung et al. (§5) repeat this for their own observer.
How FDS uses it
The Fire Dynamics Simulator (FDS) User’s Guide (McGrattan et al. 2025,
§22.10.5, Eq. 22.23) writes the law as \(S = C/K\), with C = 8 for a
light-emitting and C = 3 for a light-reflecting sign, citing Mulholland
(2002), and uses C = 3 by default (VISIBILITY_FACTOR). FDS reports
visibility up to 30 m by default (MAXIMUM_VISIBILITY, §22.10.5).
The SFPE Handbook chapter on CFD fire modelling (McGrattan and Merci 2026,
Ch. 40, Eq. 40.22, p. 1206) gives the same constants, 3 for reflecting and
8 for illuminated signs, citing the Jin and Mulholland chapters of the
4th edition (2008).
Two recent papers describe how the law is used. Börger, Belt and Arnold (2024, §1, p. 1) attribute the ranges 2–4 and 5–10 to Jin (1970), black smoke to Jin (1971) and irritancy to Jin (1972), as this page does, and apply the law along lines of sight to exit signs. Among the 210 practitioners who answered the question in a survey, C = 3 was the most common single choice; at K = 0.33 1/m it gives about 9 m, against about 24 m for C = 8 (Węgrzyński et al. 2026, §4.4, Fig. 7a).
How pyFDS-Evac uses this: see wayfinding and the smoke-speed model.
How it is verified: Familiarity and the sign-legibility rows of the Verification index; the coupled visibility-gating test is missing (#22).
Sources
Read for this page:
- Jin, T. (1970). Visibility through fire smoke (I) [煙中の見透し距離に ついて (I)]. Bulletin of the Fire Prevention Society of Japan, 19(2), 1–8. In Japanese with an English abstract. doi:10.11196/kasai.19.2.1
- Jin, T. (1971). Visibility through fire smoke (II). Bulletin of the Fire Prevention Society of Japan, 21(1), 17–23. In Japanese with an English abstract. doi:10.11196/kasai.21.17
- Jin, T. (1972). Visibility through fire smoke (III) [煙中の見透し距離に ついて (III)]. Bulletin of Japanese Association of Fire Science and Engineering, 22(1–2), 11–15. In Japanese with an English abstract. doi:10.11196/kasai.22.11
- Jin, T., & Yamada, T. (1985). Irritating effects of fire smoke on visibility. Fire Science and Technology, 5(1), 79–90. doi:10.3210/fst.5.79
- Jin, T. (1997). Studies on human behavior and tenability in fire smoke. Fire Safety Science, 5, 3–21. §2.1, Table 1, pp. 9–11. doi:10.3801/iafss.fss.5-3, publications.iafss.org
- Jin, T. (2002). Visibility and human behavior in fire smoke. SFPE Handbook of Fire Protection Engineering, 3rd ed., Ch. 2-4, 2-42–2-53. National Fire Protection Association, Quincy, MA. Table 2-4.2, p. 2-47. No DOI or public URL.
- Jin, T. (1978). Visibility through fire smoke. Journal of Fire & Flammability, 9, 135–155 (April 1978). The scan ends at p. 155; the pages 135–157 given in some citations do not match it. No DOI or public URL.
- Jin, T. (1981). Studies of emotional instability in smoke from fires. Journal of Fire & Flammability, 12(2), 130–142 (April 1981). No DOI or public URL.
- Jin, T. (1971). Visibility through fire smoke (Part 2. Visibility of monochromatic signs through fire smoke). Report of Fire Research Institute of Japan, 33, 31–49 (English, pp. 31–48; Japanese abstract p. 49). nrifd.fdma.go.jp
- Jin, T. (1975). Visibility through fire smoke (Part 3. Visibility of flashing sign), pp. 1–5, and (Part 4. Experiment on light scattering coefficient of various fire smokes), pp. 6–10. Report of Fire Research Institute of Japan, 40. In Japanese with English abstracts (pp. 5, 10). nrifd.fdma.go.jp
- Mulholland, G. W. (2002). Smoke production and properties. SFPE Handbook of Fire Protection Engineering, 3rd ed., Ch. 2-13, 2-258–2-268. National Fire Protection Association, Quincy, MA. No DOI or public URL.
- Yamada, T., & Akizuki, Y. (2026). Visibility and human behavior in fire smoke. SFPE Handbook of Fire Protection Engineering, 6th ed., Ch. 68, 2201–2224. Eqs. 68.8–68.10, Table 68.2, Fig. 68.15, pp. 2208–2211; Table 68.3, p. 2215. doi:10.1007/978-3-031-59212-6_68
- Yamada, T., & Akizuki, Y. (2016). Visibility and human behavior in fire smoke. SFPE Handbook of Fire Protection Engineering, 5th ed., Ch. 61, 2181–2206. Table 61.3, p. 2198. doi:10.1007/978-1-4939-2565-0_61
- Purser, D. A., & McAllister, J. L. (2026). Assessment of hazards to occupants from smoke, toxic gases, and heat. SFPE Handbook of Fire Protection Engineering, 6th ed., Ch. 70, 2271–2352. pp. 2284–2285, Table 70.3. doi:10.1007/978-3-031-59212-6_70
- Purser, D. A., & McAllister, J. L. (2016). Assessment of hazards to occupants from smoke, toxic gases, and heat. SFPE Handbook of Fire Protection Engineering, 5th ed., Ch. 63, 2308–2428. p. 2338. doi:10.1007/978-1-4939-2565-0_63
- Purser, D. A. (2002). Toxicity assessment of combustion products. SFPE Handbook of Fire Protection Engineering, 3rd ed., Sec. 2, Ch. 6. NFPA, Quincy, MA. p. 2-118. No DOI or public URL.
- Cheung, W. K., Bielawski, J., Arnold, L., Huang, X., & Węgrzyński, W. (2026). Reappraisal of Jin’s visibility through fire smoke experiment: Insights into signage visibility and the impact of ambient light. Fire Safety Journal, 159, 104573. doi:10.1016/j.firesaf.2025.104573
- Börger, K., Belt, A., & Arnold, L. (2024). A waypoint based approach to visibility in performance based fire safety design. Fire Safety Journal, 150, 104269. doi:10.1016/j.firesaf.2024.104269
- Węgrzyński, W., Spodyniuk, N., Zimny, M., Jahn, W., Vigne, G., & Arnold, L. (2026). Tenability criteria in performance-based fire safety engineering: practitioner’s perspectives from a global survey. Fire Safety Journal, 165, 104938. doi:10.1016/j.firesaf.2026.104938
- McGrattan, K., & Merci, B. (2026). Modeling fires using computational fluid dynamics (CFD). SFPE Handbook of Fire Protection Engineering, 6th ed., Ch. 40, 1197–1221. Eq. 40.22, p. 1206. doi:10.1007/978-3-031-59212-6_40
- Jin, T. (1976). Visibility through fire smoke, Part 5: Allowable smoke density for escape from fire. Report of Fire Research Institute of Japan, 42, 11–18. No DOI or public URL.
- McGrattan, K., Hostikka, S., Floyd, J., McDermott, R., Vanella, M., Mueller, E., & Paul, C. (2025). Fire Dynamics Simulator User’s Guide. National Institute of Standards and Technology (NIST) Special Publication 1019, 6th ed., revision FDS-6.10.1-0-g12efa16, §22.10.5. github.com/firemodels/fds/releases/tag/FDS-6.10.1
- Wood, P. G. (1972). The Behaviour of People in Fires. Fire Research Note No. 953, Fire Research Station, Borehamwood. No DOI or public URL.
- Wood, P. G. (1980). A survey of behaviour in fires. In D. Canter (Ed.), Fires and Human Behaviour (pp. 83–95). John Wiley & Sons, Chichester. ISBN 0-471-27709-6. No DOI or public URL. The UK survey was completed in 1972 (p. 94).
Cited by the sources above, not obtained:
Jin, T. (1969). Abstract, Lecture Meeting of the Architectural Institute of Japan, p. 77. Cited by FRI Report 33 (ref. 5, p. 48) for signs whose place is unknown to the observer.
Jin, T. (1972). Transactions of the Architectural Institute of Japan, No. 192. Cited by Jin (1972, p. 15) for \(\delta_c\) = 0.05–0.10 when the sign’s location is unknown.
Jin, T. (1974). Bulletin of Japanese Association of Fire Science and Engineering, 23(1–2), 1. Cited by Jin (1978, ref. 8) for the spectral extinction and the colour ratios of Table 1.
Moriya, T., & Watanabe, A. (1967). Kasai, 17, 137. Cited by Jin (1978, ref. 7, p. 142) for about 10 minutes of escape.
Horiuchi, S., Murozaki, M., & Jin, T. (1974). Abstract, Annual Meeting of the Architectural Institute of Japan (Planning), 581. Source of the group-walking data in Jin (1978, Fig. 10).
Yamada, T., Kubota, K., Abe, N., & Iida, A. (2004). Visibility of emergency exit signs and emergency lights through smoke. Proc. 6th Asia-Oceania Symposium on Fire Science and Technology, Daegu, 227–238. Reported through Ch. 68 (ref. 18).