Design fires
ASET depends on the fire, and a fire model needs its heat release rate (HRR) over time as input. A design fire is that input chosen for an engineering analysis: an idealised HRR curve; a fire follows its own course. The published conventions are the t² growth law and its four classes, how growth is capped, steady fires, fits to tests, and what a design fire represents. The last section lists the fires used in the pyFDS-Evac studies.
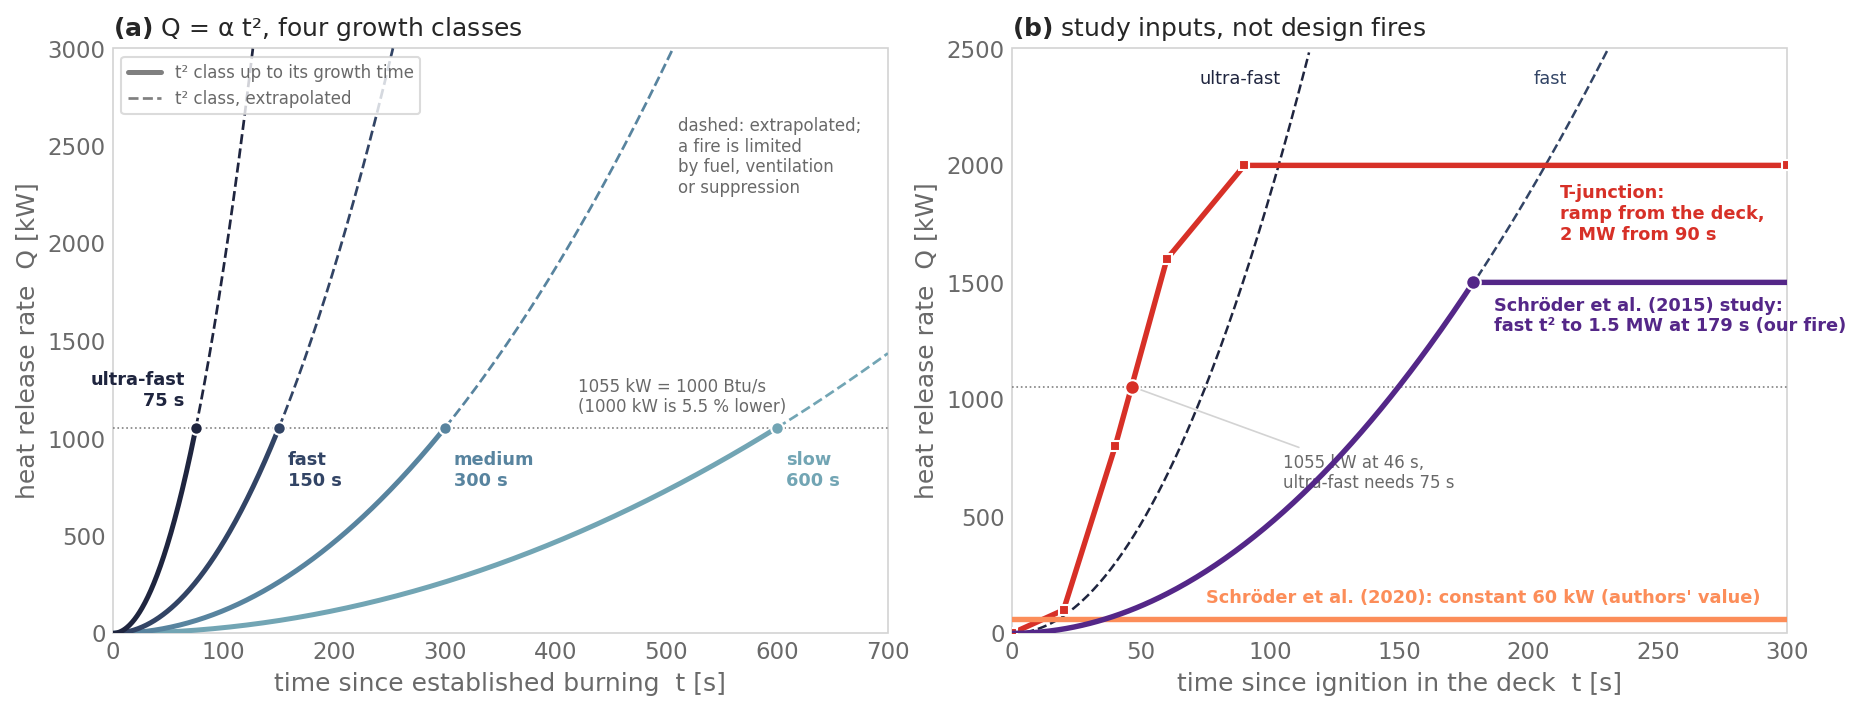
(a) The four t² classes of vfdb Table 4.3 and SFPE Table 36.1. Each
curve is solid up to its growth time, when it reaches 1055 kW, and dashed
beyond. (b) The three study fires, with the fast and ultra-fast classes for
reference. The T-junction ramp is read from its FDS deck; it passes
1055 kW at 46 s. The Schröder et al. (2015) route-study fire is read
from its deck (HRRPUA and TAU_Q); it follows the fast class up to its
1.5 MW cap at 179 s. Script: scripts/figures/fundamentals_design_fires.py.
Design fire scenario and design fire
The vfdb guide separates the two (vfdb 2020, §4.1, pp. 39–40):
- A design fire scenario describes a fire case in words: where the fire starts, what burns, and which fire protection works or fails.
- A design fire turns the scenario into numbers, mainly an HRR curve over time.
Design fires are chosen so that a fire in that use exceeds them only with a very low probability: “worst credible”, not “worst case” (§4.1, pp. 40–41). The guide calls a design fire a theoretical but possible curve that covers many fires on the safe side (§4.3.1.1, p. 53). The SFPE Handbook likewise calls the assumed fire characteristics of a scenario the “design fire” and describes them as a time-dependent HRR (Fleischmann and Wade 2026, Ch. 3, p. 54).
The scenario is chosen for the goal of the analysis. For egress, a small fire at the main exit can matter more than a large fire elsewhere (Fahy and Nilsson 2026, Ch. 4, p. 74). The same building can give very different ASET and RSET depending on whether occupants are awake or asleep and whether the fire smoulders or flames (Babrauskas et al. 2010, p. 353).
A design fire stands for a range of possible fires. It lets the engineer compare safety measures, and it is chosen by judgement and checked by varying it (Karlsson and Quintiere 2000, §3.5.1).
The t² law as published
The early growth of a fire is nearly always accelerating. The simplest description takes the HRR as growing with the square of time (Karlsson and Quintiere 2000, §3.4.4, Eq. 3.7; vfdb 2020, §4.3.2.1, Eq. 4.1, p. 58):
$$ \dot Q = \alpha\, t^2 $$\(\dot Q\) is the HRR in kW, \(\alpha\) the growth factor in kW/s², and \(t\) the time in s. The clock starts at established burning, not at ignition. vfdb counts \(t\) without the ignition and smouldering phase; Karlsson and Quintiere count it from the time \(t_0\) when flaming starts and significant energy is released, which depends on the fuel and the ignition source. vfdb also writes the law with an offset (Eq. 4.2, p. 58):
$$ \dot Q = \dot Q_S + \dot Q_0 \left(\frac{t}{t_g}\right)^2, \qquad \dot Q_0 = 1000\ \mathrm{kW} $$where \(\dot Q_S\) is the HRR at \(t_0\), when the incipient fire turns into a spreading fire, and \(t_g\) is the characteristic growth time. vfdb writes \(t_\alpha\) on p. 58 and \(t_g\) later in the chapter.
The four growth classes
The growth time \(t_g\) is the time to reach 1000 Btu/s, about 1055 kW, so \(\alpha = 1055/t_g^2\) (Olenick and Cleary 2026, Ch. 43, Eq. 43.23, p. 1283; Fleischmann and Wade 2026, Eq. 3.1, p. 58; Karlsson and Quintiere 2000, §3.4.4, after NFPA 204M).
| Class | \(t_g\) [s] | \(\alpha\) [kW/s²] | Typical use (vfdb Table 4.2) | Typical fuels (SFPE Table 3.5) |
|---|---|---|---|---|
| Slow | 600 | 0.002931 | picture gallery | densely packed wood products |
| Medium | 300 | 0.01172 | dwelling, office, hotel reception and rooms | solid wood furniture such as desks; single items with little plastic |
| Fast | 150 | 0.04689 | shop | high-stacked wood pallets, cartons on pallets, some upholstered furniture |
| Ultra-fast | 75 | 0.1876 | industrial storage, production hall | upholstered furniture, high-stacked plastics, thin wood furniture such as wardrobes |
\(\alpha\) as printed in vfdb Table 4.3 (p. 60), which takes \(\alpha\) from Drysdale and \(t_g\) from NFPA 92B. SFPE Table 36.1 (Hunt and Floyd 2026, p. 1116, from NFPA 72) prints 0.00293, 0.01172, 0.0469 and 0.1876. Karlsson and Quintiere Table 3.5 rounds them to 0.003, 0.012, 0.047 and 0.19. The occupancy column of vfdb Table 4.2 comes from BSI DD 240.
vfdb calls these values guidance, not normative (p. 59, footnote 1). The mapping from occupancy to class is not universal either: vfdb puts offices at medium, while a Swedish proposal in Karlsson and Quintiere (Table 3.7, “not approved yet”) puts schools and offices at fast.
1000 kW or 1055 kW? The sources use both
The class values of \(\alpha\) are normalised to 1000 Btu/s = 1055 kW: vfdb Table 4.3 says so in its footnote (1 Btu/s ≈ 1055.056 W), and the SFPE Handbook defines \(t_g\) (Ch. 43, p. 1283) and \(t_{1055}\) (Ch. 3, Eq. 3.1 and Table 3.5, p. 58) as the time to 1055 kW. Check: 1055/600² = 0.00293, 1055/300² = 0.01172, 1055/150² = 0.04689 and 1055/75² = 0.18756 kW/s².
Other passages use 1000 kW. vfdb Eq. 4.2 sets \(\dot Q_0\) = 1000 kW, and its Table 4.3 heads the \(t_g\) column “time to reach 1 MW”. The 2016 edition of the SFPE Handbook defined a \(t_{1000}\), the time to reach 1000 kW (Hadjisophocleous and Mehaffey 2016, Eq. 38.1 and Table 38.2, pp. 1271–1272); Chs. 3 and 43 of the 2026 edition use 1055 kW.
With 1000 kW, the same \(t_g\) gives an \(\alpha\) 5.5 % lower (1000/1055). The four class names and growth times are the same in all sources; only \(\alpha\) differs. When a report quotes a class, check which normalisation it uses.
How growth ends
The t² curve describes growth only. A fire stops growing, and the design fire must say when and how.
- Fuel or ventilation limit. The maximum HRR is the lesser of the fuel-controlled and the ventilation-controlled maximum (vfdb 2020, §4.3.2.3, Eq. 4.4, p. 62; Fleischmann and Wade 2026, pp. 58–59). The curve follows t² up to that maximum and then levels off at a steady value.
- Flashover. In a room fire the t² curve holds only up to flashover and needs enough air. At flashover the curve is left and the HRR rises quickly to the room’s maximum (vfdb 2020, p. 59). The SFPE Handbook usually ignores that short rise and jumps to the post-flashover level (Ch. 3, p. 59).
- A local fire in a large hall stops growing when it reaches the maximum HRR of its limited burning area (vfdb 2020, p. 59).
- Decay. The curve must be checked against the fire load that is present (vfdb 2020, p. 59). Decay starts after about 70 % of the releasable energy is spent, vfdb (§4.3.3.4, p. 70), or after 70–80 % of the design fire load, SFPE (Ch. 3, p. 59), and both allow a linear fall. For life safety the first 10–30 min matter, so the steady phase is often assumed to continue with no decay (Karlsson and Quintiere 2000, §3.5.4).
- Sprinklers. The SFPE Handbook typically assumes that sprinklers stop the growth but do not suppress the fire: the HRR stays at its value at activation. Often the HRR drops, but suppression is not usually credited; the effect depends on the fire size at activation and on whether the fire is shielded from the spray (Fleischmann and Wade 2026, pp. 58–60). vfdb gives a simplified curve: t² growth up to activation, then constant for 5 min, then a linear fall to zero over 25 min (§7.3.3, Eqs. 7.1–7.3, p. 278). Any credit for sprinklers must allow for the chance that the system fails (vfdb 2020, §4.2, item 5, p. 47).
Steady fires
A steady fire keeps a constant HRR, either from ignition or after a ramp. It is the growth → steady shape above with the growth phase left out or shortened. It is an idealised source: easy to reproduce and compare, but it skips the early growth that often decides detection and the first smoke.
Fits to tests and real events
A growth factor can also be fitted to calorimeter data for one item. Karlsson and Quintiere (Table 3.4) and the SFPE Handbook (Olenick and Cleary 2026, Table 43.4, p. 1288) list such fits for the same furniture calorimeter tests. The tests suggest growth times between 50 and 500 s (p. 1287). A fit follows the test only from its “virtual time”, when the test starts to follow the t² curve, and it does not predict when growth stops or when the fuel runs out (p. 1287). A fitted \(\alpha\) describes one item under one ignition; a value such as 0.1055 kW/s² sits between fast and ultra-fast. A piecewise-linear ramp has no \(\alpha\); compare a ramp with the classes by the time it takes to reach 1055 kW.
What a design fire represents
- A fire chosen to be exceeded rarely. The fire that occurs follows its own curve.
- An input to the analysis. The verdict on the building comes from comparing ASET with RSET under stated criteria.
- One part of the scenario. The same curve can sit in different scenarios, at a different place or with different doors open.
- A property of the fuel. A growth class describes the fuel and its arrangement. Contents change over the life of a building.
- The heat release rate only. The HRR does not fix the smoke. Soot and other product yields must be given separately (vfdb 2020, p. 60). For visibility this matters as much as the HRR. Yields also change: the CO yield can vary by up to a factor of about 50 between well-ventilated flaming (φ < 1) and fuel-rich (φ > 1) burning (Purser 2003, p. 93, citing Tewarson).
Known limits
- The t² law comes from free-burning tests. In a small enclosure the hot layer feeds heat back to the fuel, and in a closed one oxygen runs short; the free-burning rate must then be adjusted (Fleischmann and Wade 2026, p. 58).
- The incipient phase is left out. Smouldering before \(t_0\) releases little heat but can produce smoke that triggers detectors before growth starts (Karlsson and Quintiere 2000, §3.5.2; the SFPE Handbook leaves the incipient and smouldering phase out of its design fires, Ch. 3, p. 54).
- Life safety and structure use different curves. For escape the time frame is mostly under 30 min and the design fire is an HRR curve; for structural stability it is a temperature–time curve over 0.5–3 h (Karlsson and Quintiere 2000, §3.5.1). Standard temperature–time curves do not belong in an egress analysis.
Fires used in pyFDS-Evac studies
These are the fires of the Studies. They are study inputs, chosen for each study’s question. None of them was chosen by the design-fire procedure above, so none is a design fire, and none is a pyFDS-Evac default. Each new study adds a row here and one to the Studies index.
| Study | Curve type | Parameters | Stated or assumed |
|---|---|---|---|
| ASET-RSET maps after Schröder et al. (2020) | Steady from ignition | 60 kW: HRRPUA 60 kW/m² on 1 × 1 m; polyurethane (NFPA Babrauskas), soot yield 0.129. Sensitivity: HRRPUA 166.7 kW/m² on 0.6 × 0.6 m, flexible polyurethane foam | From the authors’ reference implementation (doi:10.5281/zenodo.3875550); the paper’s text does not state the fire. The sensitivity burner and fuel are ours |
| Route choice in smoke after Schröder et al. (2015) | t² growth to a cap | Fast, α = 0.047 kW/s², capped at 1.5 MW (HRRPUA 250 kW/m² on 3 × 2 m) at 179 s; PVC, soot yield 0.172, CO yield 0.063; ceiling 4.0 m. Comparison: medium, α = 0.012 kW/s² (cap at 354 s), ceiling 3.0 m; and fast with ceiling 3.5 m | Ours. The paper does not state its fire. Chosen before any routing run, then picked among nine variants by visual match to the paper’s smoke snapshot (Fig. 6c) |
| With and without the fire | Piecewise-linear ramp, then steady | 0, 100, 800, 1600, 2000 kW at 0, 20, 40, 60, 90 s; 2 MW to 300 s (HRRPUA 1000 kW/m² on 2 m²); fuel vinyl chloride (PVC), 16.4 MJ/kg | From the deck assets/t_junction/t_junction.fds. Not a t² class: it passes 1055 kW at 46 s, faster than ultra-fast (75 s). The deck comments and README disagree with the deck (#280) |
All fires start at t = 0 with no incipient phase.
Sources
- vfdb (2020). Leitfaden Ingenieurmethoden des Brandschutzes, TB 04-01, 4th ed., March 2020, J. Zehfuß (ed.). Vereinigung zur Förderung des Deutschen Brandschutzes. §4.1 (pp. 39–40); §4.2, item 5 (p. 47); §4.3.1.1 (p. 53); §4.3.2.1, Eqs. 4.1–4.2 (p. 58), p. 59 and Tables 4.2–4.3 (p. 60); §4.3.2.3, Eq. 4.4 (p. 62); §4.3.3.4 (p. 70); §7.3.3, Eqs. 7.1–7.3 (pp. 276–278). NFPA 92B and BSI DD 240 are cited here through this guide.
- Fleischmann, C., & Wade, C. (2026). Fire scenarios. SFPE Handbook of Fire Protection Engineering, 6th ed., Ch. 3, 43–72. Eq. 3.1 and Table 3.5, pp. 54, 58–60. doi:10.1007/978-3-031-59212-6_3
- Fahy, R., & Nilsson, D. (2026). Selecting scenarios for deterministic fire safety engineering analysis: life safety for occupants. SFPE Handbook of Fire Protection Engineering, 6th ed., Ch. 4, 73–89. p. 74. doi:10.1007/978-3-031-59212-6_4
- Hunt, S. P., & Floyd, J. E. (2026). Flame height, fire plumes, and ceiling jets. SFPE Handbook of Fire Protection Engineering, 6th ed., Ch. 36, 1091–1129. Table 36.1, p. 1116. NFPA 72 is cited here through this chapter and Ch. 43. doi:10.1007/978-3-031-59212-6_36
- Olenick, S. M., & Cleary, T. G. (2026). Detection. SFPE Handbook of Fire Protection Engineering, 6th ed., Ch. 43, 1273–1333. Eq. 43.23 and Table 43.4, pp. 1283, 1287–1288. doi:10.1007/978-3-031-59212-6_43
- Hadjisophocleous, G. V., & Mehaffey, J. R. (2016). Fire scenarios. SFPE Handbook of Fire Protection Engineering, 5th ed., Ch. 38, pp. 1271–1272. Cited only for the \(t_{1000}\) of that edition. doi:10.1007/978-1-4939-2565-0_38
- Karlsson, B., & Quintiere, J. G. (2000). Enclosure Fire Dynamics. CRC Press, Boca Raton. §3.4.4 (Eq. 3.7, Tables 3.4–3.5), §3.5.1–3.5.4 (Table 3.7). NFPA 204M is cited here through this book.
- Purser, D. A. (2003). ASET and RSET: addressing some issues in relation to occupant behaviour and tenability. Fire Safety Science, 7, 91–102, p. 93. doi:10.3801/IAFSS.FSS.7-91
- Babrauskas, V., Fleming, J. M., & Russell, B. D. (2010). RSET/ASET, a flawed concept for fire safety assessment. Fire and Materials, 34(7), 341–355, p. 353. doi:10.1002/fam.1025
How the fire reaches pyFDS-Evac: the FDS case supplies it, see Your FDS case. How ASET follows from it: ASET, RSET and the egress timeline.