ASET-RSET maps after Schröder et al. (2020)
Schröder, Arnold and Seyfried (2020) turned the ASET-RSET comparison from one number at one point into maps: a time for every map element of a room (0.6 m in their demonstration). This page re-runs their demonstration case under the conditions of the authors’ release, with our own FDS fire and pyFDS-Evac crowds, and shows three things:
- ASET per fire quantity. When each cell first exceeds a limit for smoke, temperature, CO, CO₂, radiation and dose, and which of them matter for this fire.
- RSET per cell. When the last person leaves each cell (paper §2.3). In the paper’s method this map is the evacuation side, compared with ASET cell by cell.
- DIFF = ASET − RSET. Where in the room the smoke arrives before the last person has left, and how the door-flow model, pre-movement and a second door move that.
Download the files for this page (235 kB zip)
scripts/docs/schroeder_room_maps.py builds the maps; a
built-in version is planned in
#210. The
page reports research software applied to one room and gives no design or
safety verdict.The result in brief
One door, the exit flow capped at 1.00 persons/s, everyone moving at t = 0, smoke criterion K ≥ 0.23 1/m at 2.0 m, maximum over n = 10 seeds:
| 1 door, 0.2 m grid | 1 door, 0.1 m grid | 2 doors, 0.2 m grid | Paper, Fig. 5 (read off) | |
|---|---|---|---|---|
| min DIFF | −27 s | −27 s | −40 s | about −29 s |
| Area with DIFF < 0 | 6.7 m² | 6.4 m² | 7.4 m² | about 20 m² |
| C (bin-free) | −112 m²s | −107 m²s | −174 m²s | – |
| RSET, latest cell | 101 s | 101 s | 63 s | about 104 s (Fig. 3) |
- Smoke sets ASET here. Every cell reaches K ≥ 0.23 1/m at 2.0 m, the last one at 83 s (84 s on the 0.1 m grid, 83 s with two doors). The temperature, radiation and dose limits are reached only next to the burner, if at all. The release fire produces no CO, so the CO criteria do not apply.
- The queue at the door fails. The negative cells are the corner in front of the door, where people wait at the capped exit. Smoke reaches those cells at 72–74 s; the last person leaves them at about 100 s.
- The door-flow model decides the one-door sign. Without the cap, the room empties in 42–45 s and no cell has DIFF < 0. With two doors even the uncapped crowd fails, by 11 s, beside the west door near the fire.
- The grids agree. The 0.1 m FDS grid moves min DIFF by less than 1 s and the negative area by 0.3 m².
- The negative area is about a third of the paper’s. The release’s own RSET map has a queue about twice as large as ours (Against the paper).
What changed against the earlier version of this page
The earlier version rebuilt the room from the paper’s text and figures
alone (the hrr060 family). The page now follows the authors’ release,
and the hrr060 family is a sensitivity
(Sensitivity: the room rebuilt from the paper alone).
Between the two, the engine changed how agents leave at an exit
(#349,
#401). The
middle column separates that code change from the change of conditions.
Earlier page (hrr060, commit 30ca7f5) | hrr060 on the current engine | Release conditions (this page) | |
|---|---|---|---|
| Door | 1.2 m, y = 8.2–9.4 m | 1.2 m | 1.0 m, y = 8–9 m |
| Burner | 0.6 × 0.6 m at x, y = 0.6–1.2 m | same | 1 × 1 m at x, y = 1–2 m |
| Fuel | flexible PU foam GM21: soot yield 0.131, CO yield 0.010, χr 0.52 | same | PU (NFPA Babrauskas): soot yield 0.129, no CO, χr 0.35 (FDS default) |
| Free speed v0 | 1.2 m/s | 1.2 m/s | N(1.3, 0.1) m/s |
| Exit cap | 0.96 persons/s (paper Fig. 3) | 0.96 | 1.00 (release trajectories) |
| Exit rule | removed within r + 0.5 m of a point in the exit | centre within 0.03 m of the exit polygon | same |
| Agents left at 40 / 80 s (mean) | 62.2 / 24.1 | 62.5 / 24.3 | 60.5 / 20.5 |
| Last agent out, one door, capped | 104–106 s | 105–106 s | 100–101 s |
| Latest ASET cell, 0.2 / 0.1 m grid | 88 / 203 s | 88 / 203 s | 83 / 84 s |
| min DIFF, one door, 0.2 m (0.1 m) | −30 s (−25 s) | −31 s (−26 s) | −27 s (−27 s) |
| Area DIFF < 0, one door, 0.2 m (0.1 m) | 6.2 m² (5.5) | 6.2 m² (5.8) | 6.7 m² (6.4) |
| C, one door, 0.2 m (0.1 m) | −113 m²s (−87) | −118 m²s (−92) | −112 m²s (−107) |
| min DIFF / area, two doors | −41 s / 6.2 m² | −42 s / 5.8 m² | −40 s / 7.4 m² |
| min DIFF / area, two doors, N = 200 | −103 s / 21.9 m² | −103 s / 21.9 m² | −97 s / 22.9 m² |
| min DIFF, uncapped, one / two doors | +3 s / +1 s | +2 s / −4 s | +4 s / −11 s |
The engine change moves min DIFF by about 1 s. The release conditions move it by about 4 s and bring the two FDS grids into agreement. The uncapped two-door run turns negative with the exit-rule change already (+1 → −4 s, not robust over seeds: per-seed mean +0.3 s); the release conditions deepen it to −11 s, negative in the per-seed mean as well (−4.6 [−6.9, −2.5] s).
The room
A 30 × 10 × 3 m room with one door, a fire in the opposite corner and 100 people who all start moving at once (paper §2.1). The paper’s text gives no fire details (“as the fire properties are of no importance for this work, we deliberately leave out details”). We take them from the authors’ release:
- a constant 60 kW fire, HRRPUA 60 kW/m² on a 1 × 1 m floor vent at x, y = 1–2 m, burning polyurethane (NFPA Babrauskas, soot yield 0.129), with the FDS defaults for everything the release leaves unset;
- one door, 1.0 m wide at y = 8–9 m in the east wall, 2.0 m high, open;
- 100 people placed at random over the floor, free speed N(1.3, 0.1) m/s, the exit capped at 1.00 persons/s, the flow we measured from the release’s ten JuPedSim runs.
We run FDS 6.10.1 on 0.2 m cells (0.1 m as a grid check) to 600 s, and the collision-free speed model with radius 0.15 m, 10 seeds per version. Every input, with its source, is under Setup, deviations and caveats.
ASET: which fire quantity matters
ASET of a cell is the first time a criterion holds anywhere in that cell at 2.0 m, counted from ignition. We screened every criterion of three published sets, plus the pyFDS-Evac doses, and counted the cells that exceed each one by 600 s. The headline set is vfdb Table 8.3, < 30 min: the only column that contains both of the paper’s values. The paper cites vfdb for 0.23 1/m only and names no column (our inference); the vfdb < 5 min column and EA Fig. 8 are sensitivity rows. Smoke sets ASET under all three.
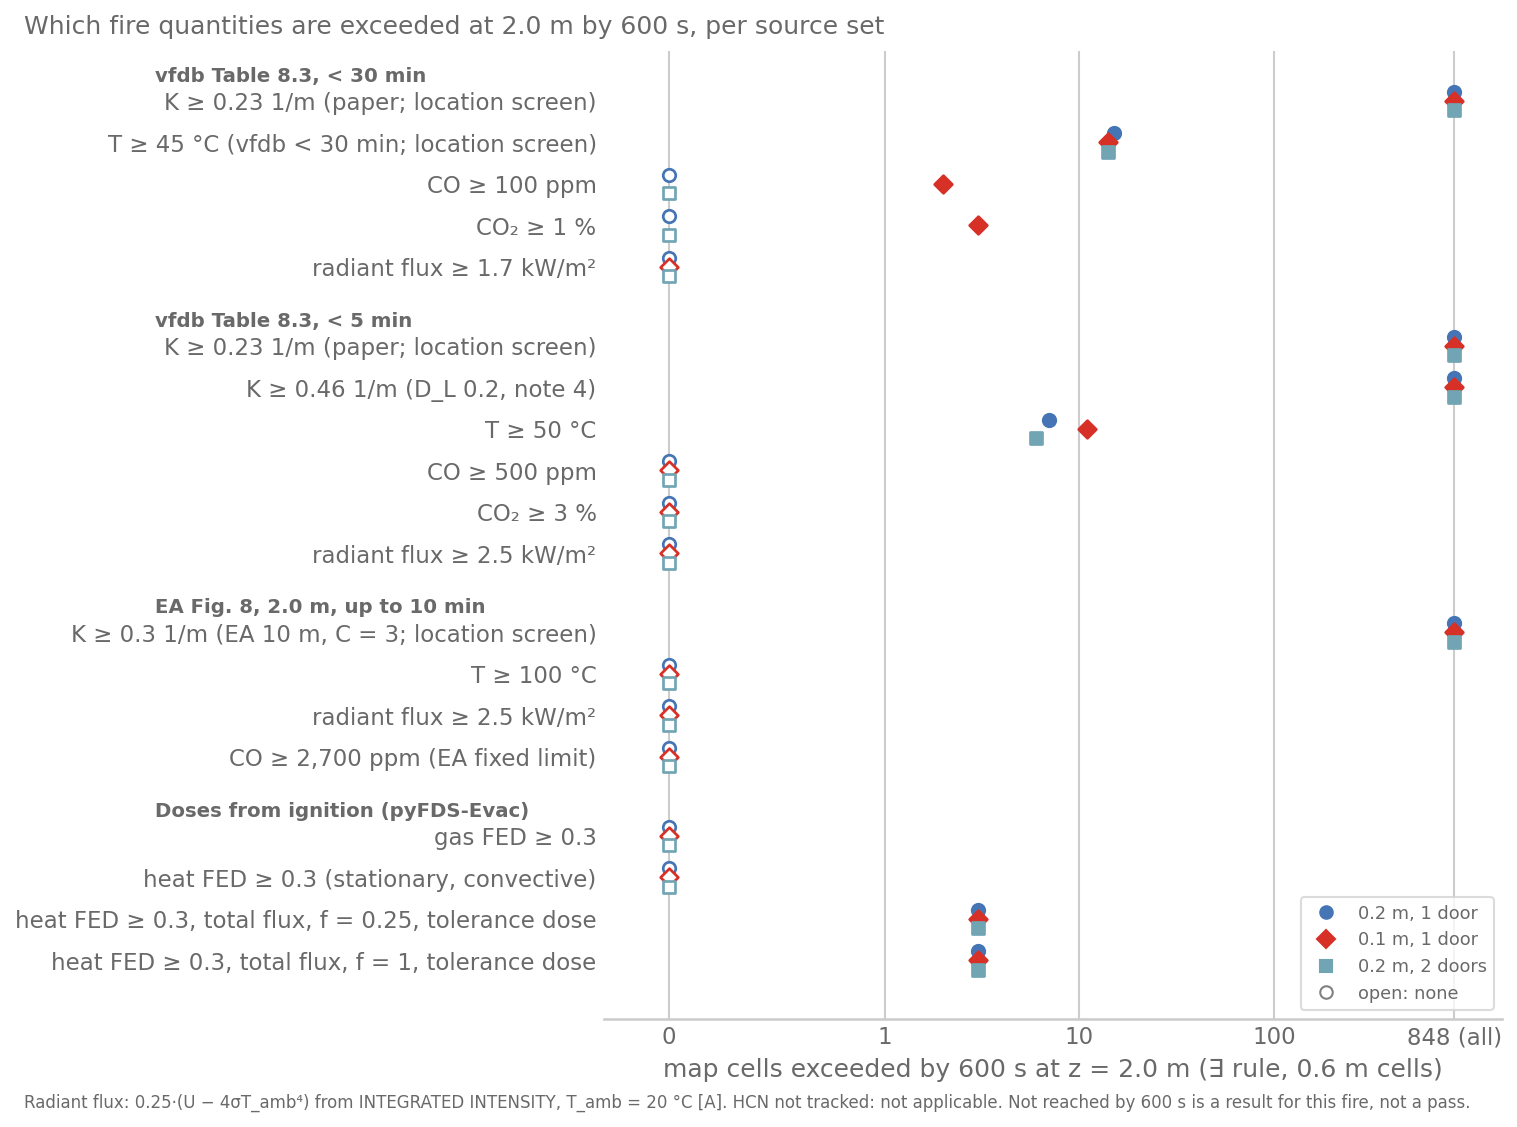
Map cells (0.6 m) exceeded by 600 s at z = 2.0 m, any FDS node of the cell. Open markers: no cell. One marker shape per FDS run.
| Source set | Criterion | 0.2 m, 1 door | 0.1 m, 1 door | 0.2 m, 2 doors |
|---|---|---|---|---|
| vfdb Table 8.3, < 30 min | K ≥ 0.23 1/m (the paper’s criterion) | all 847, from 4 s | all 847, from 4 s | all 845, from 4 s |
| T ≥ 45 °C | 22, within 2.6 m of the burner | 24, within 3.2 m | 22, within 2.6 m | |
| CO ≥ 100 ppm | not applicable: CO yield 0 | |||
| CO₂ ≥ 1 % | 0 | 3, within 0.1 m | 0 | |
| radiant flux ≥ 1.7 kW/m² | 0 | 0 | 0 | |
| visibility (Erkennungsweite) 10–20 m | not screened: covered by D_L (note 6) | |||
| vfdb Table 8.3, < 5 min | K ≥ 0.23 1/m (D_L 0.1) | all 847 | all 847 | all 845 |
| K ≥ 0.46 1/m (D_L 0.2, note 4) | all 847 | all 847 | all 845 | |
| T ≥ 50 °C | 14, within 1.0 m | 20, within 2.0 m | 17, within 1.5 m | |
| CO₂ ≥ 3 %, radiant flux ≥ 2.5 kW/m² | 0 | 0 | 0 | |
| EA Fig. 8 (Short Exposure, p. 15), 2.0 m, up to 10 min | K ≥ 0.3 1/m (10 m visibility with C = 3) | all 847, from 4 s | all 847 | all 845 |
| T ≥ 100 °C | 0 | 5, within 0.7 m | 0 | |
| radiant flux ≥ 2.5 kW/m² | 0 | 0 | 0 | |
| Doses from ignition | gas FED ≥ 0.3 | 0 | 0 | 0 |
| heat FED ≥ 0.3, convective | 0 | 0 | 0 | |
| vfdb and EA | CO, HCN | not applicable: not produced (CO yield 0) or not tracked | ||
| – | irritants | not applicable: the fuel has no tracked irritant |
“0” means not reached by 600 s at 2.0 m for this fire. Where a criterion reads “not applicable”, the fire model does not produce the quantity, so the map says nothing about it.
The largest values anywhere on the 2.0 m slice, 0–600 s (0.2 m / 0.1 m grid, one door): K 6.4 / 10.4 1/m, T 80 / 118 °C, CO₂ 0.65 / 1.16 %, O₂ never below 19.9 / 19.2 %, gas FED 2.4·10⁻⁵ / 8.5·10⁻⁴ (CO₂ and O₂ terms only), convective heat FED 0.070 / 0.097.
What the criteria are, and what they mark
- The criteria are guideline acceptance values. K ≥ 0.23 1/m and 45 °C are vfdb TB 04-01 (2020), Table 8.3, values for a stay of up to 30 minutes, well below any incapacitation endpoint for a person. The paper uses both (0.23 1/m p. 3; 45 °C p. 4, Fig. 4) and cites vfdb, but does not name the column; 45 °C occurs only in the < 30 min column. K = 0.23 1/m is D_L = 0.1 1/m converted with vfdb Eq. 8.1 (K = D_L · ln 10). ISO 13571:2012 §4.6 f treats the early effects of obscuration as behavioural and leaves them out of its incapacitation model. How these values compare with other published criteria is under Tenability criteria in the literature.
- Each set is shown whole. Taking CO from one source and temperature from another would mix two sets of assumptions.
- The time column is a sensitivity. vfdb defines the long class as a stay of about 15–30 min (p. 324), so for evacuations under 5 minutes it is the more conservative choice. The < 5 min column gives 50 °C instead of 45 °C, and allows D_L = 0.2 1/m where the area is clearly laid out or people know it (note 4).
- vfdb assumes a mixed fire load. The guide values assume typical mixed fire loads and a CO : HCN ratio of 12.5 : 1 (pp. 323, 325); vfdb calls for a dose analysis for sensitive groups, very short or very long exposures, or unusual smoke composition (p. 324). Our polyurethane burner is a single fuel. vfdb also calls toxicity criteria “not conservative” and says they should not replace layer or smoke criteria (p. 312).
- Temperature is assessed together with smoke. vfdb Table 8.3, note 2: gas temperature is not to be assessed in isolation from smoke density. T ≥ 45 °C is never the first criterion in a cell here; it ties with smoke in 7 cells at the burner (0.2 m, one or two doors; 5 on the 0.1 m grid).
- EA gives no visibility constant. K ≥ 0.3 1/m for 10 m visibility uses C = 3, our assumption. EA §5.2 also allows 5 m (K ≥ 0.6 with C = 3) in enclosures of about 10 m, and reduced visibility where occupants may be queuing next to exits, which is where DIFF is negative here, subject to assessment of CO and HCN levels (§5.2, p. 15). This fire produces neither.
- Radiant flux is estimated as 0.25 · (U − 4σT_amb⁴) from the FDS
INTEGRATED INTENSITYU, with T_amb = 20 °C (assumed): a small body in an isotropic field receives about U/4. - Gas FED ≥ 0.3 is the dose of someone standing still from ignition, with the pyFDS-Evac form of the FDS+Evac FED (Fractional effective dose). With no CO and no HCN, only its CO₂ and O₂ terms act. ISO 13571:2012 §5.4 requires a reduced threshold for more conservative objectives; A.5.2 gives 0.3 as an example, at which about 11.4 % of a population would still be susceptible (see Incapacitation thresholds).
- Heat FED ≥ 0.3 uses the clothed convective form of ISO 13571:2012 §8.3.1, Eq. (9) (Heat). ISO gives no numeric threshold; §8.5 applies the chosen one as for the gases. The 0.3 is a pyFDS-Evac choice, by analogy with A.5.2.
- Total-flux heat, as a sensitivity. The total-flux dose (SFPE Handbook Ch. 70, Eq. 70.41) with the radiant part f · (U − 4σT_skin⁴). Even at f = 1, the upper bound the engine accepts, the radiant part peaks at 1.7 kW/m² and stays below the 2.5 kW/m² from which ISO counts it, so the dose comes from the convective part alone and is the same for f = 0.25 and f = 1. The tolerance dose reaches 0.3 in 3 cells next to the burner, from 344 s (0.2 m), 259 s (0.1 m) or 393 s (two doors).
Tenability criteria in the literature
A tenability criterion turns a fire field into a time. Published criteria differ in four ways: the effect they mark, whether they are a limit or a dose, the exposure time and height they assume, and the share of the population they cover. The physiology behind each hazard is on the Fundamentals pages (incapacitation thresholds, visibility, heat, irritants, ASET and RSET).
Where this page’s criteria sit. The vfdb < 30 min values are fixed, location-based guide values: the most conservative of the three stay classes, at the lower end of the smoke limits in the literature and well below any incapacitation endpoint. A map that crosses them shows where conditions stop meeting the protection goal. Incapacitation needs a dose along each person’s path.
How published criteria differ: effect, limit or dose, time and height, population
Effect. The fractional effective dose (FED) comes from rat data: the dose is summed until it reaches the one that produces a chosen effect, such as incapacitation or death (Hartzell and Emmons 1988, p. 356). ISO 13571:2012 sets FED = 1 at the median of “compromised tenability”, the loss of acceptable cognitive and motor performance (§3.1, §5.4). The Engineers Australia (EA) fixed limits are incapacitation tolerances for 10 min; CO 2,700 ppm matches about 27,000 ppm·min (§5.2, p. 15). The vfdb values are one level lower: guide values (Anhaltswerte) for protection goals, which at light activity reach FED ≈ 0.3 at the end of each stay class (Table 8.3 p. 325; Fig. 8.4, pp. 326–327). Purser and McAllister list escape impairment, incapacitation and death as separate columns per irritant (SFPE Handbook Ch. 70, Table 70.4, p. 2288).
Limit or dose. A fixed limit is checked at every place and instant. A dose must be summed along each person’s path, which couples the fire and evacuation models (Węgrzyński et al. 2026, §1–2). ISO 13571 uses doses for asphyxiant gases and heat, and the current concentration for irritants (§4.2, §4.4). vfdb and DIN 18009-2 base every assessment on fixed limits; a person-based dose, with a justified FED threshold, may be added for special cases (DIN §7.2.2–7.2.3, pp. 22–24). Our reading: the three vfdb CO values are almost the same dose, 2,500–3,000 ppm·min, about one tenth of the incapacitating dose EA cites.
Time and height. vfdb has three stay classes, up to about 5 min, about 5–15 min and about 15–30 min; the goal is met if no value is exceeded during the stay (p. 324). EA’s fixed limits assume up to 10 min and use FED for up to 30 min (§5.2–5.3, pp. 15–17). DIN adds the AEGL-2 for CO as a check, 420 ppm for 10 min and 150 ppm for 30 min, without interpolation (§7.2.3). EA, DIN and C/VM2 evaluate at 2.0 m (EA §5.2; DIN §7.2.1; C/VM2 §2.1.6.1); the 2012 commentary to C/VM2 sums the doses for the last occupant to leave the room of fire origin, in steps of at most 5 s (MBIE 2012, pp. 47, 49). Zero-exposure criteria use a clear layer of about 2.5 m (vfdb §8.1, p. 312; Purser and McAllister, p. 2340). Surveyed practitioners use 1.5–2.5 m, most often 2.0 m (52.1 %) (Węgrzyński et al. 2026, §4.3).
Population. ISO requires a threshold below 1 for more conservative objectives; its informative annex gives 0.3 as an example, under which 11.4 % of the population would still be affected, with no assurance that these percentages are valid (§5.4, A.5.2). Purser and McAllister suggest a design FED of 0.3 for the general population, or 0.1 for particularly sensitive groups such as occupants of health-care premises (Ch. 70, p. 2288; worked example, p. 2322); one passage instead gives 0.1 as the value that protects nearly all exposed individuals (p. 2310). vfdb gives 0.1–0.3 (§8.4, p. 319). The New Zealand Building Code (clause C4.3) sets 0.3 for the CO and the thermal dose; the C/VM2 commentary reads 0.3 as about 11 % of the population (MBIE 2012, p. 29). EA considers 1.0 suitable for the vast majority of occupants and leaves the margin to RSET (§5, p. 13). In the survey, 7 of the 13 continental-European respondents who stated a value use 0.1; all from the UK and Australia/New Zealand use 0.3 (§4.3). Babrauskas et al. (2010, p. 347) ask whether criteria should protect the average person, a chosen case of infirmity, or a level well below the mean, and find no agreement in the profession.
Smoke. ISO 13571 leaves the behavioural effects of smoke out of its model (§4.6 f). Its obscuration endpoint, sight of about arm’s length at 0.8 g/m³ (clause 9, Note 1), is K ≈ 8 1/m with σ = 10 m²/g (our conversion), about 35 times vfdb’s 0.23 1/m. The lower limits come from behaviour: Purser and McAllister list ‘30 % people turn back rather than enter’ at about 3 m. In the surveys behind that entry, 26 % (UK; Wood 1972, Fig. 6) and 29 % (US; Bryan 1977, p. 213) of those who had entered smoke turned back, at any visibility, and the US group’s mean self-estimated visibility on turning back was 9.9 ft ≈ 3 m (Bryan 1977, Table LIV). Purser and McAllister also suggest limits of 0.08 OD/m (K ≈ 0.18, our conversion) for large enclosures and 0.2 OD/m (K ≈ 0.46) for small ones (Table 70.3, p. 2284). Where D_L ≤ 0.1 1/m, the toxic and temperature values are usually met as well (vfdb p. 325; DIN §7.2.2). In the survey (254 respondents, a convenience sample), visibility is the criterion most often decisive (91.4 %); FED is used by 22.2 % (§4.3–4.4).
Criticism. Babrauskas et al. call the tenability criteria proposed at the time (their example is the 2007 draft of ISO 13571) “highly arbitrary” with “little basis in either physics or physiology” (2010, p. 347). Their paper predates every source above except Gann et al. (2001). The NIST sublethal-effects study puts a factor of two on its generic values (Gann et al. 2001, pp. 82–86).
| Source | Kind | What reaching the value means | Time, height |
|---|---|---|---|
| vfdb TB 04-01, Table 8.3 (p. 325) | fixed guide values | protection goal not met (FED ≈ 0.3 at end of stay, light activity) | < 30 / ≈ 15 / < 5 min; height not in the table |
| DIN 18009-2:2022, Table 1 (pp. 22–23) | same values, taken from vfdb (Note 2) | route no longer available | 2 m (§7.2.1) |
| EA 2014, §5.2 Fig. 8 (Short Exposure, p. 15) | fixed limits | incapacitation, 10-min tolerance | ≤ 10 min; 2.0 m |
| NZBC C4.3, C/VM2 2nd ed. §2.1.6 (p. 17) | dose (FED) for CO and heat, fixed limit for visibility | Building Code performance criterion not met | along the escape route, through the evacuation; 2.0 m |
| ISO 13571:2012 | dose (FED), concentration (FEC) | compromised tenability, median at 1.0; threshold chosen by the user | integrated over time; no height given |
| Purser & McAllister 2026, Ch. 70 | dose + suggested limits | incapacitation; escape impairment | integrated over time |
The values. vfdb gives three per quantity, one per stay class: < 30 / ≈ 15 / < 5 min.
| Source | Smoke | Heat | Gases |
|---|---|---|---|
| vfdb | D_L 0.1 1/m (K 0.23); 0.15/0.2 where the area is clearly laid out or familiar | 45/50/50 °C; 1.7/2.0/< 2.5 kW/m² | CO 100/200/500 ppm; CO₂ 1/2/3 %; HCN 8/16/40 ppm |
| DIN 18009-2 | as vfdb | as vfdb | as vfdb; AEGL-2 CO as a check |
| EA | 10 m visibility (5 m in enclosures of about 10 m) | 100 °C; 2.5 kW/m² | CO 2,700 ppm; HCN 140 ppm |
| C/VM2 | 10 m visibility (5 m in rooms under 100 m²) | FED 0.3, radiative and convective (ISO 13571) | FED 0.3 from CO, CO₂ and O₂ (ISO 13571); in a sprinklered firecell that cannot expose more than 1,000 occupants, only this one (C4.4) |
| ISO 13571 | 0.8 g/m³ aerosol, about arm’s length (§9) | Eqs. (7)–(11); radiant counted from 2.5 kW/m² (§8.4) | FED/FEC; 0.3 as an example (A.5.2) |
| Purser & McAllister | 0.08 / 0.2 OD/m (Table 70.3, p. 2284) | Table 70.18 (p. 2319) | design FED 0.3 (0.1 for sensitive groups; p. 2288) |
Sources are in the Sources list at the end of the page.
The ASET maps
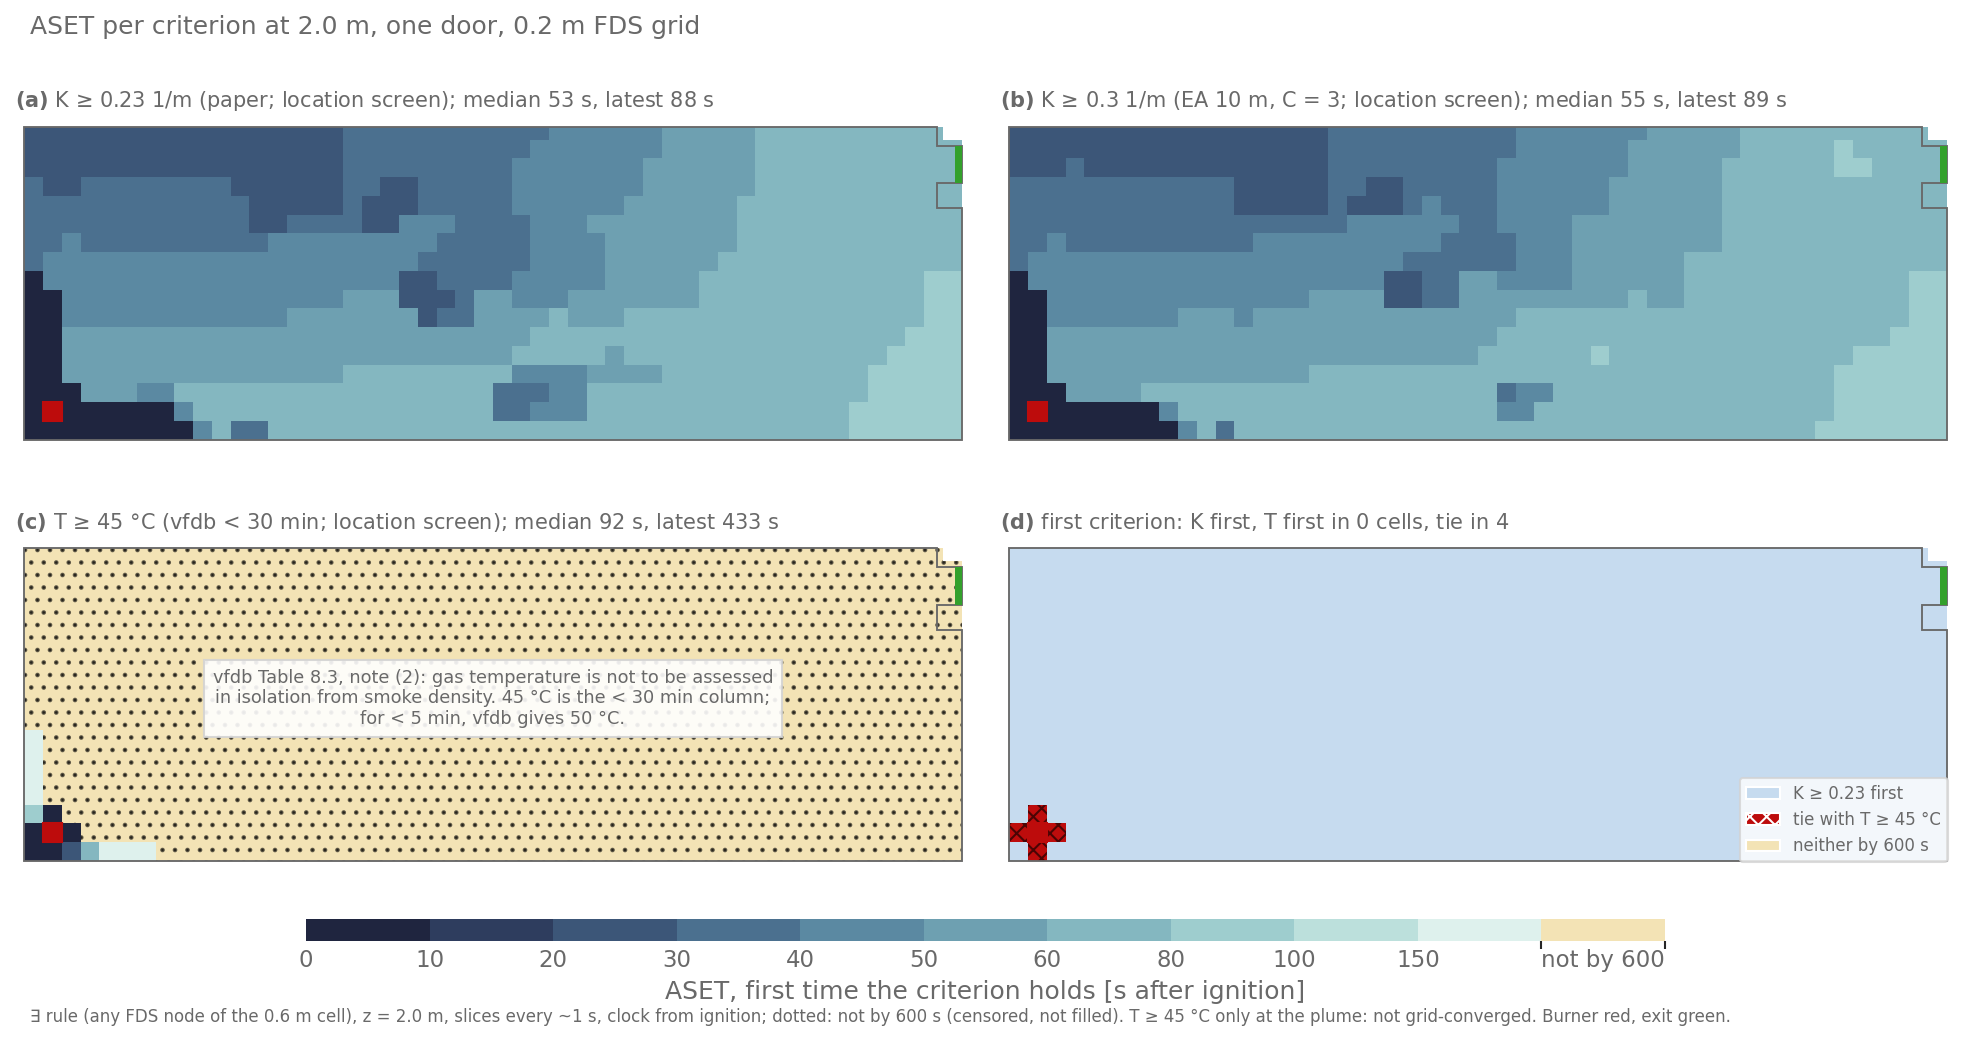
One door, 0.2 m FDS grid. Dotted beige: not by 600 s, censored and not filled with a value.
Smoke fills the room from the burner corner eastward. The plume rises along the west wall, which exceeds within 10 s. The door cells follow at 72–74 s, and the south-east corner is last, at about 83 s.
Two doors, and the 0.1 m grid
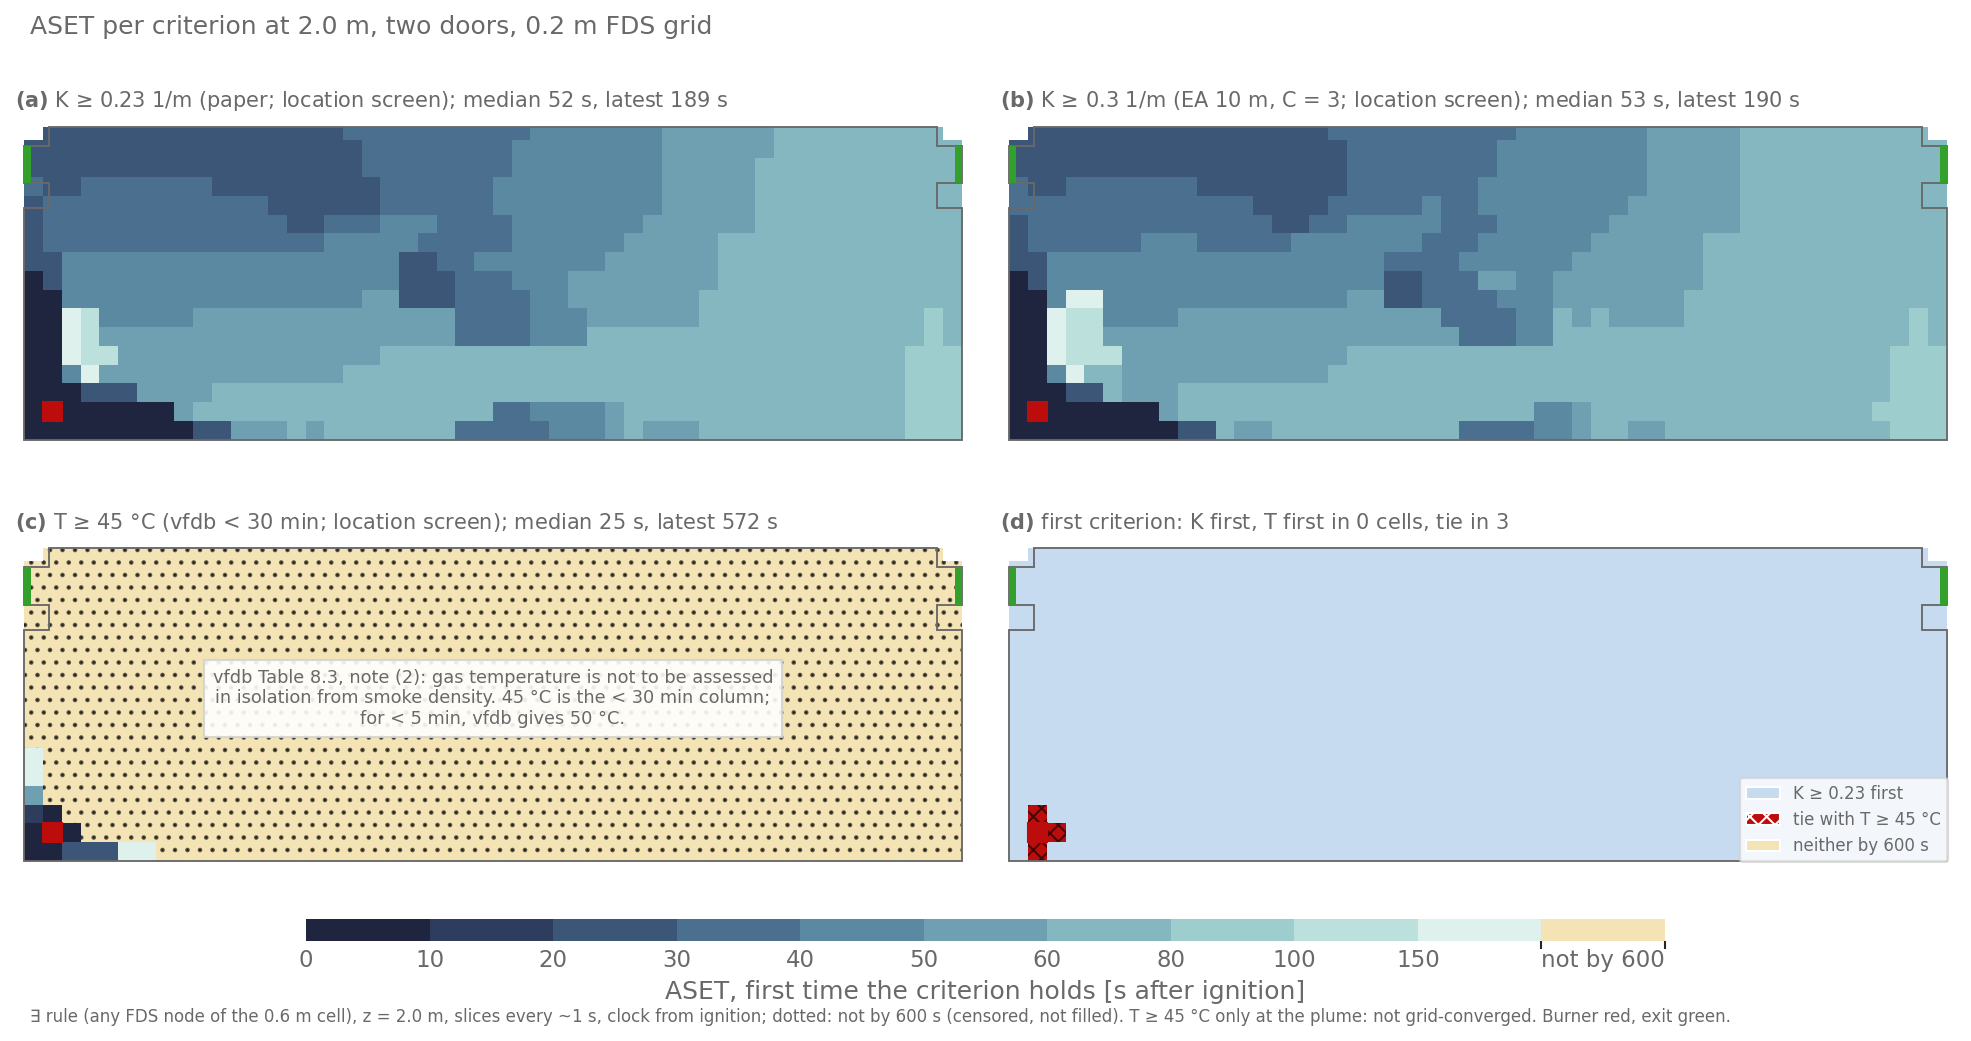
Two doors, 0.2 m FDS grid. This is a separate FDS run: the second door changes the ventilation. The cells at the west door D2 exceed K ≥ 0.23 1/m at 19–29 s, the cells at the east door D1 at 69–70 s.
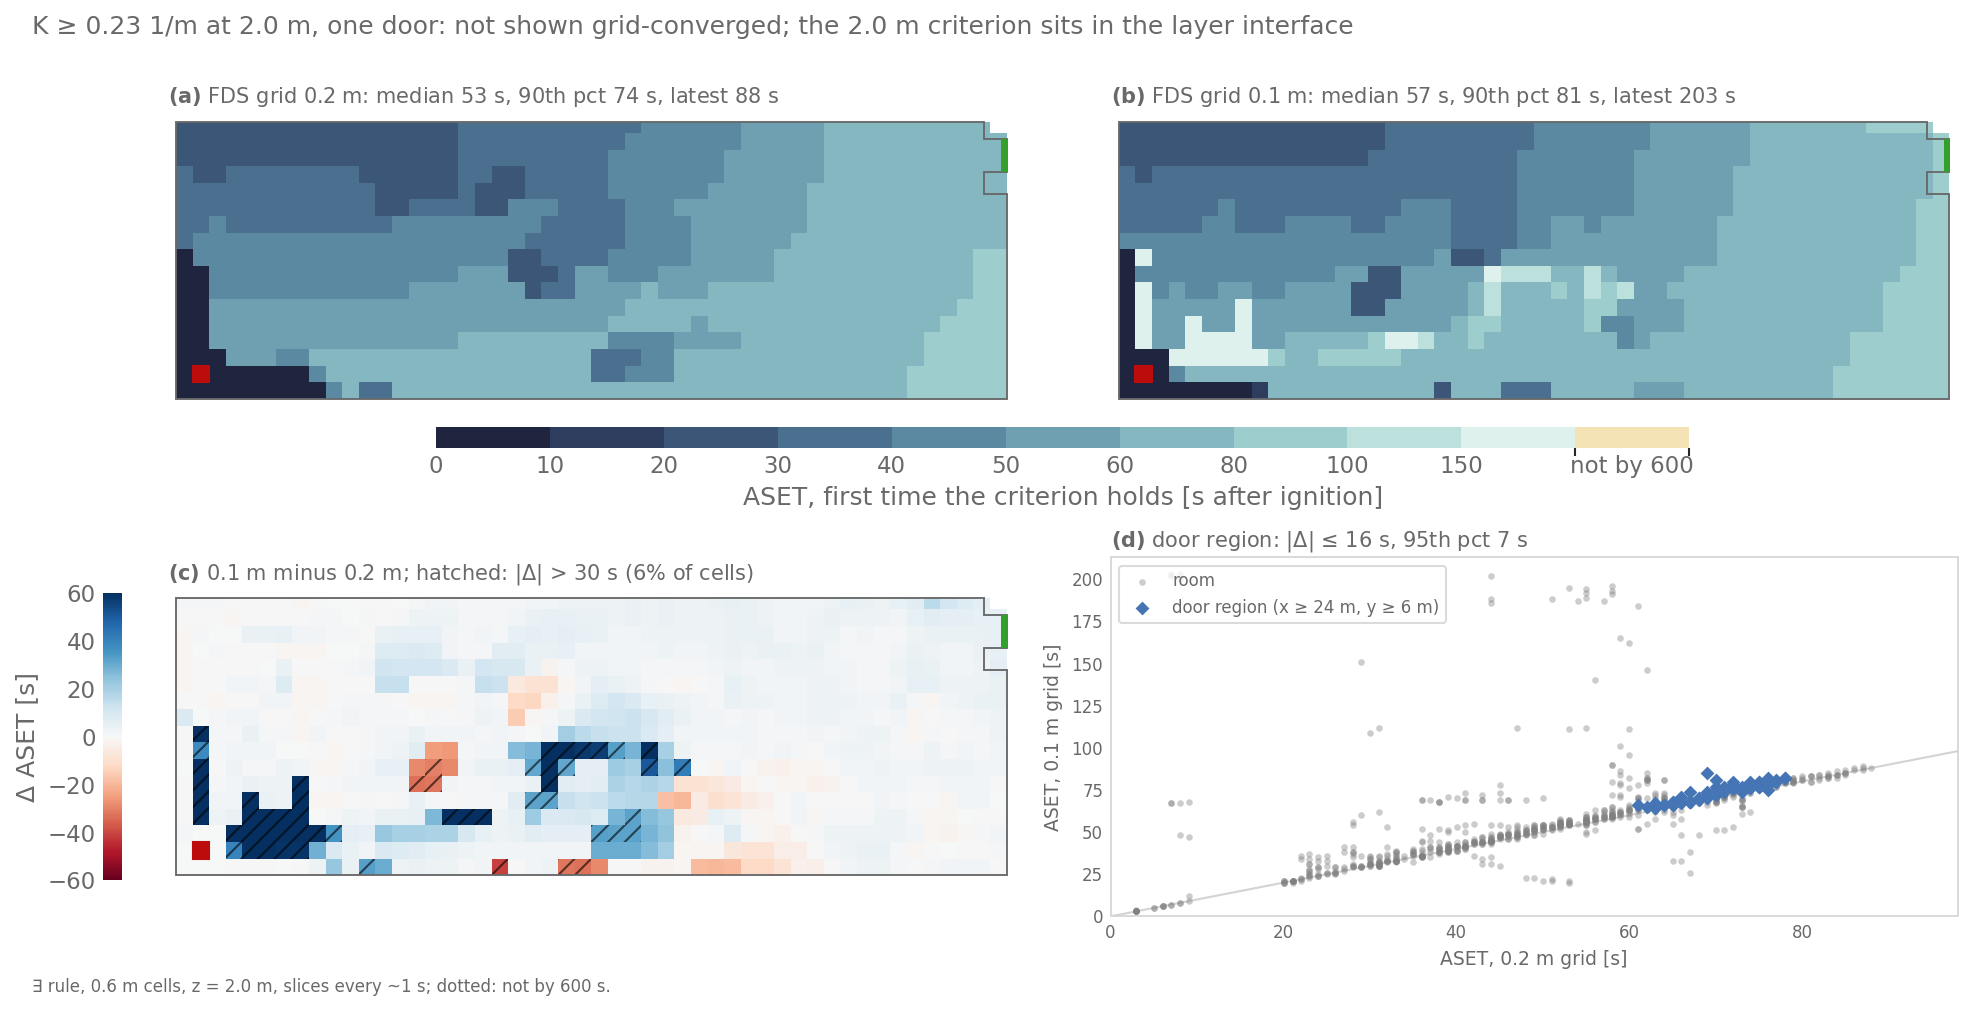
The same ASET map on two FDS grids. Mean |Δ| 4.3 s; 3.0 % of cells differ by more than 30 s, at most 51 s. In the door region (x ≥ 24 m, y ≥ 6 m) |Δ| is at most 3 s. No cell first exceeds after 120 s on either grid.
Our ASET against the release
The release contains the authors’ ASET map (0_ASET/aset_map.txt: FDS
6.5.3, K ≥ 0.23 1/m at 2.0 m, 10 s steps, cells unexceeded by 120 s set to
120 s). Built with the same 10 s steps and 120 s fill, our map has the same
median, 60 s, and puts 71 % of the cells in the same 10 s step and 87 %
within one step. Where they differ, ours is mostly earlier (21 % of cells
against 9 % later; mean −4.7 s). The release leaves 19 cells in the
western third unexceeded by 120 s; ours has none.
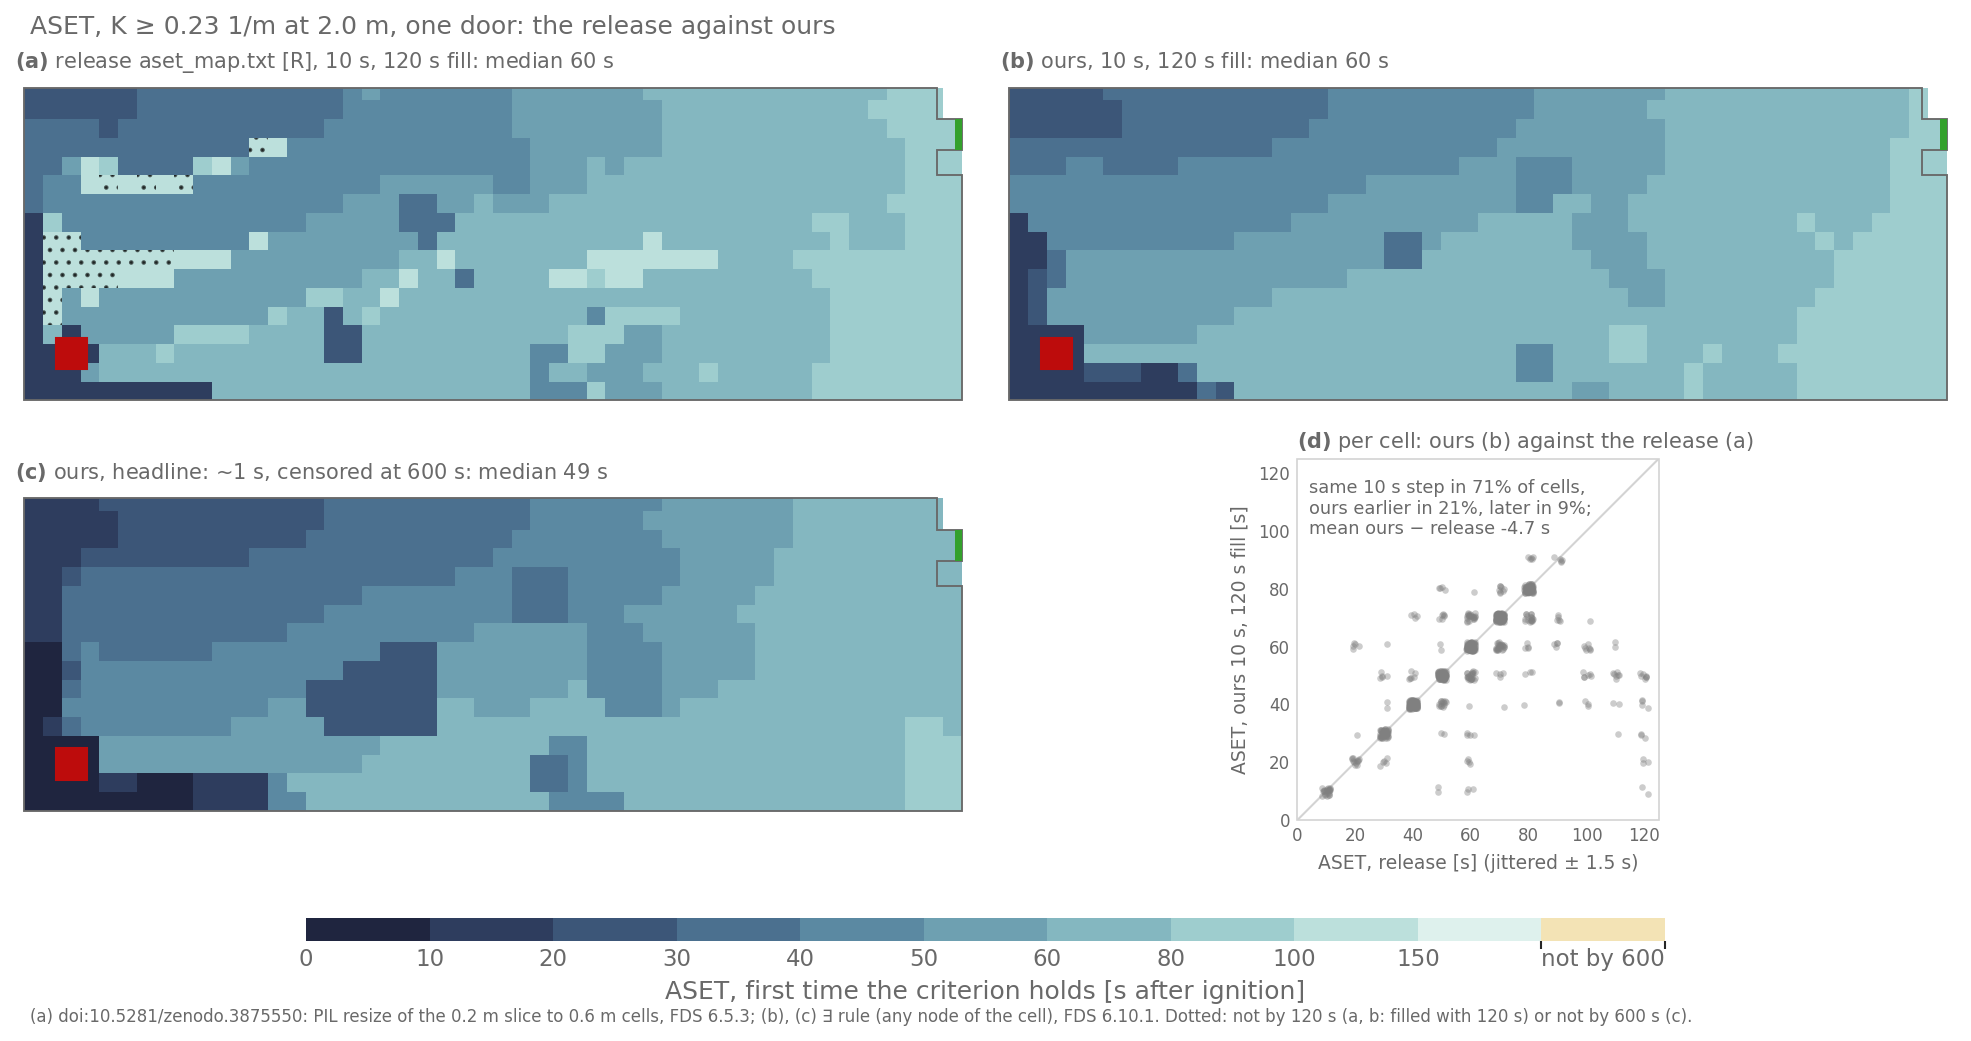
Release: doi:10.5281/zenodo.3875550, aset_map.txt, PIL resize of the
0.2 m slice to 0.6 m cells. Ours: any FDS node of the cell. Burner red,
exit green.
The fields behind the maps agree up to 40 s and then part. Compared node by node on the 2.0 m slice at 10, 20, …, 120 s, our K and the release’s lie on the same side of 0.23 1/m at 90–100 % of nodes up to 40 s. From 50 s on our K is higher by 0.03–0.05 1/m on average and the share falls to 68–85 %. The cause is not established (Caveats). The headline map uses about 1 s steps, which makes it about 6 s earlier on average than our 10 s map and 11 s earlier than the release’s.
RSET: when the last person leaves each cell
RSET of a cell is the last time any agent is in it (paper §2.3, Eqs. 4–5), counted from ignition. The agents here walk at free speed, keep their first exit and ignore the smoke (“arm U”), so their RSET does not depend on the fire.
The door flow
The collision-free speed model on its own empties the room through the 1.0 m door in 42–45 s. The release’s JuPedSim runs need 96–103 s. We therefore run two versions on the same FDS output:
- capped: the exit removes at most one agent per second
(
enable_throughput_throttling,max_throughput: 1.0; see Scenario JSON), the flow we measured over 10–90 % of the agents in the release’s ten runs (0.96–1.05 persons/s); - uncapped: the model’s own flow, reported as a model difference.
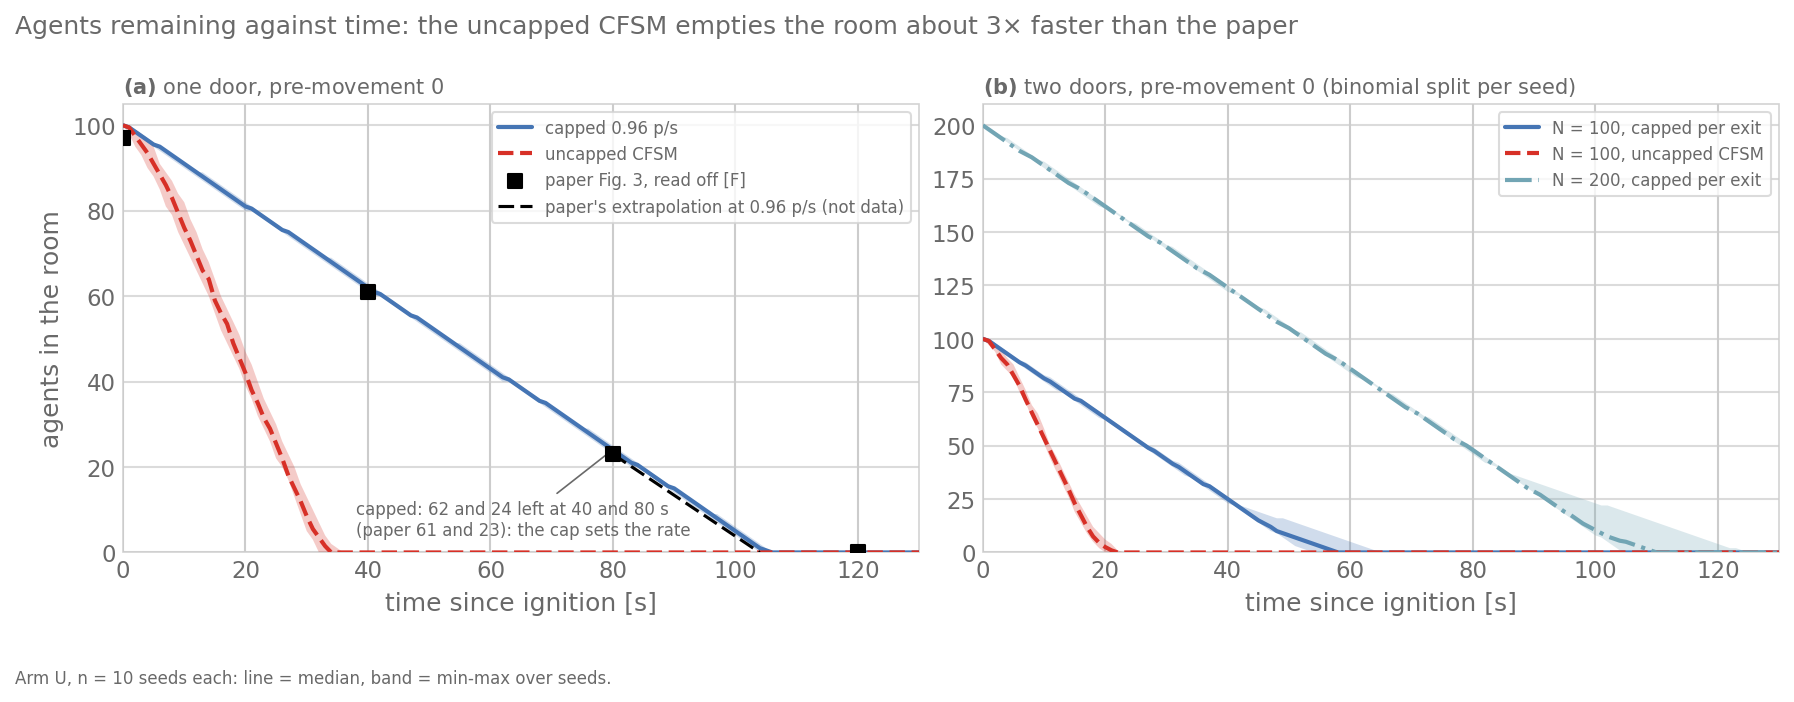
n = 10 seeds per version: line median, band minimum to maximum. Dotted grey: the release’s ten JuPedSim runs (doi:10.5281/zenodo.3875550, 1 frame/s). Black squares: the paper’s Fig. 3, read off (100 at 0 s is N).
| One door, pre-movement 0, 10 seeds | Left at 40 s, mean (range) | Left at 80 s | Last agent out |
|---|---|---|---|
| Release, JuPedSim (our count of its trajectories) | 61.2 (60–64) | 21.5 (18–24) | 96–103 s |
| Ours, capped at 1.00 persons/s | 60.5 (60–61) | 20.5 (20–21) | 100–101 s |
| Ours, uncapped | 7.5 ± 2.8 (sd) | 0 | 42–45 s |
The RSET maps
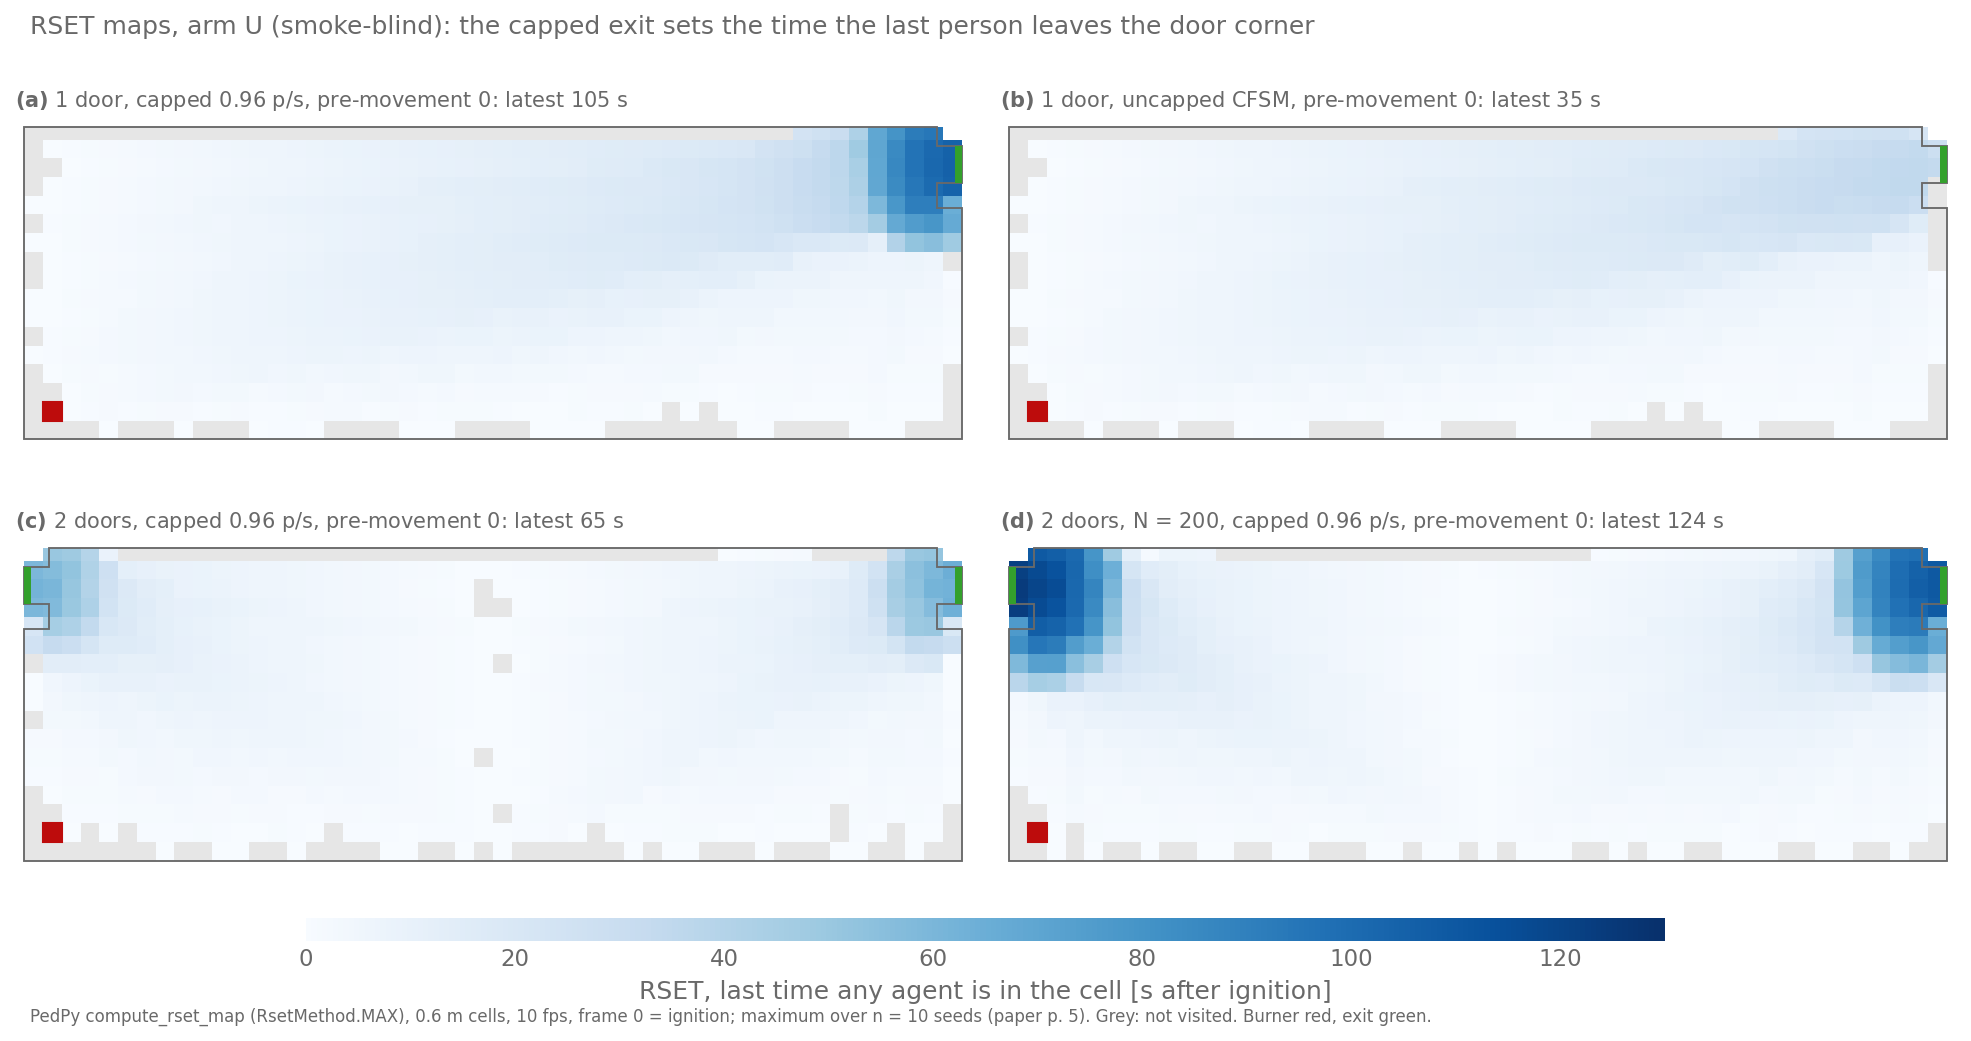
RSET, maximum over n = 10 seeds, 0.6 m cells. The plan is the same in every figure: 30 m × 10 m, burner red in the south-west corner, exits green, grey cells never visited by any agent.
With the cap, RSET is highest in the corner in front of the door, where the queue forms (101 s). Without it, no cell is occupied after 44 s. With two doors, N = 100 capped, the room is empty by 63 s; with N = 200, by 117 s.
| Version (maximum over n = 10) | Latest cell, one door | Latest cell, two doors |
|---|---|---|
| Capped, pre-movement 0 | 101 s | 63 s |
| Capped, pre-movement 10 s (the default) | 111 s | 73 s |
| Capped, pre-movement 30 s | 131 s | 93 s |
| Capped, pre-movement 60 s | 161 s | 123 s |
| Uncapped, pre-movement 0 | 44 s | 29 s |
| Capped, N = 200, pre-movement 0 | – | 117 s |
Pre-movement is a constant delay for everyone. “The default” is the
pyFDS-Evac default when a scenario sets no pre-movement key: a constant
10 s, the FDS+Evac PRE_MEAN (the gamma preset applies only on request).
DIFF: where smoke arrives before the last person leaves
DIFF = ASET − RSET per cell (paper Eq. 7). A cell fails when DIFF < 0; DIFF = 0 counts as a pass. DIFF is the time window between the first exceedance in a cell and the last presence of any agent there. The paper notes that “the exposure time of individuals cannot be concluded from this value” (p. 6); for per-agent exposure, see A crowd in a fire. Because DIFF is a margin in seconds, the maps compare versions by how much time each leaves, which is how Babrauskas et al. (2010, pp. 350–351) propose to use ASET − RSET. RSET here is the maximum over seeds, high-end with respect to the seed spread. Pre-movement is constant, so the behavioural spread that Babrauskas et al. (2010, p. 348) ask to be covered is not sampled.
One door, animated
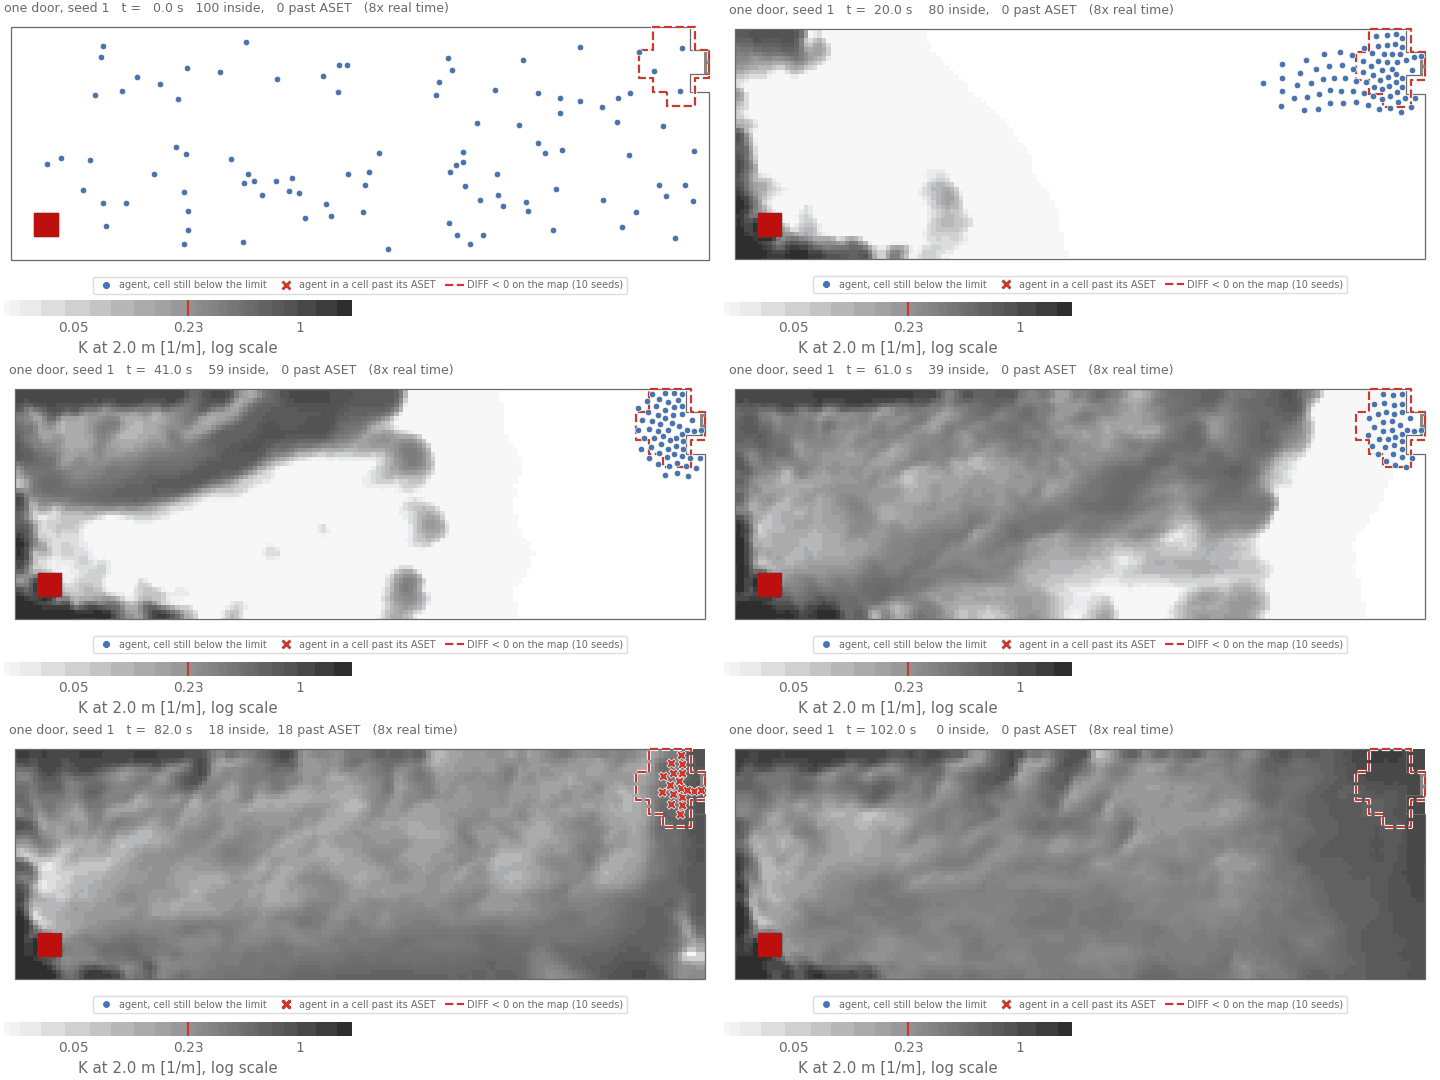
One door, exit capped at 1.00 persons/s, pre-movement 0, seed 1 (the seed
closest to the median of 99.9 s; its room empties at 99.8 s), 8 times real
time. Background: K at 2.0 m from the FDS slice. Red cross: an agent in a
cell whose ASET (K ≥ 0.23 1/m) has passed. Dashed outline: the DIFF < 0
cells of map (a) below. Regenerated by scripts/docs/study_animations.py.
Before 69 s no agent stands in a cell whose ASET has passed. From 75 s every agent still inside does, all of them in the queue at the capped door, up to 25 at 74 s. The agents ignore the smoke (arm U), so a cross marks where the map fails; nobody walks differently.
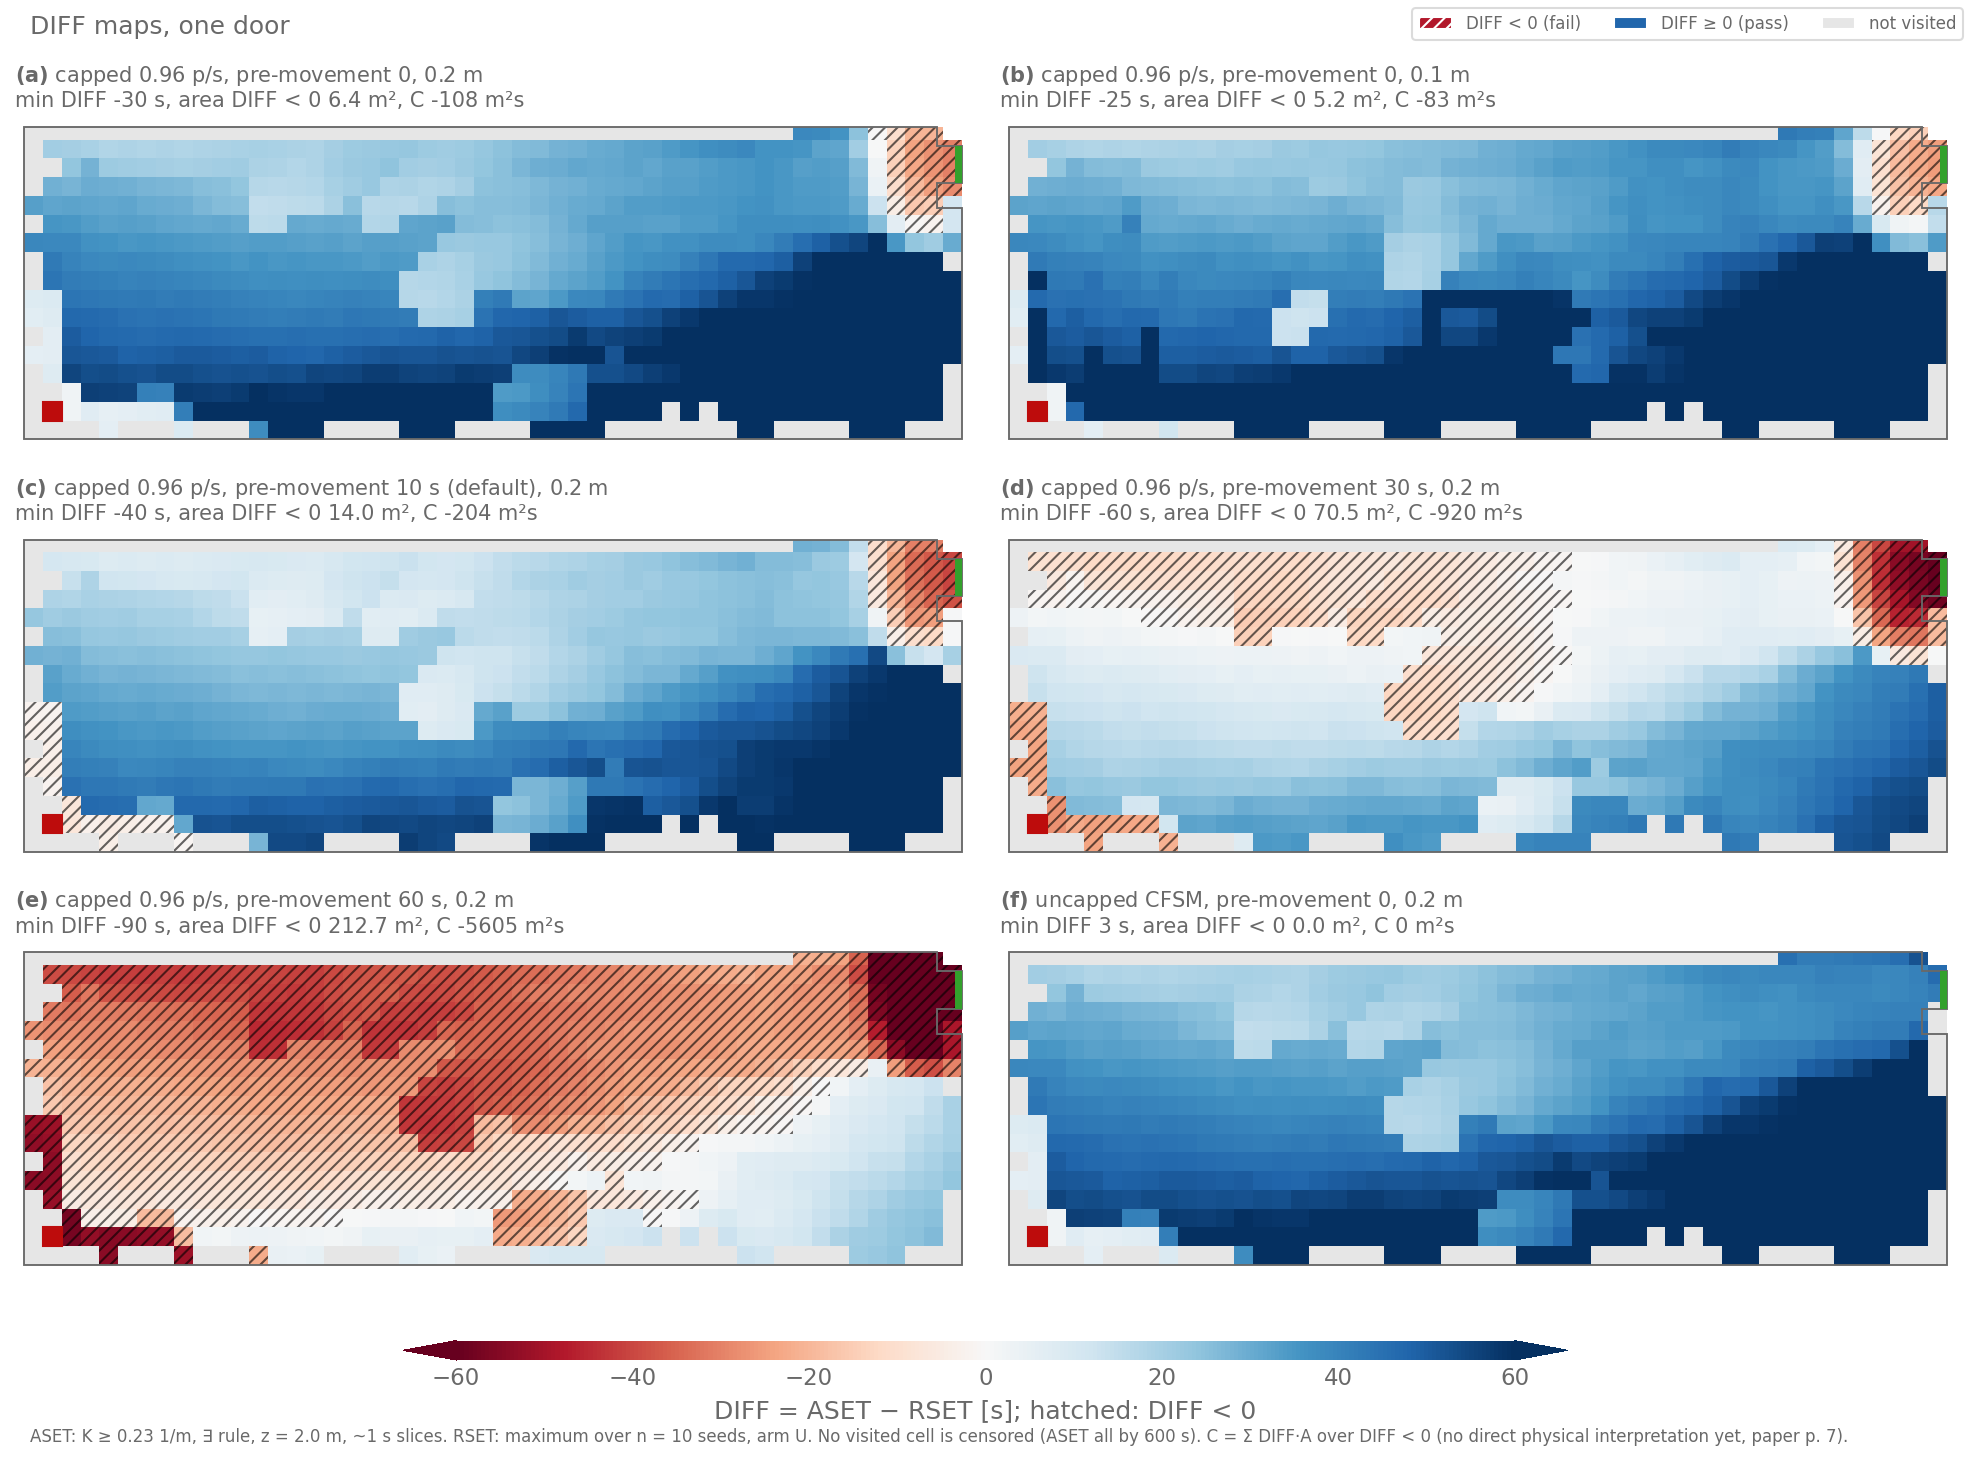
One door. ASET: K ≥ 0.23 1/m, any node of the cell, z = 2.0 m, about 1 s steps. RSET: maximum over n = 10 seeds. No visited cell is censored.
| One door, maximum over n = 10 | min DIFF | Area DIFF < 0 | C | Failing cells |
|---|---|---|---|---|
| Capped, pre-movement 0 | −27 s (−27 s) | 6.7 m² (6.4) | −112 m²s (−107) | 21 (20) |
| Capped, pre-movement 10 s | −37 s (−37 s) | 11.7 m² (10.6) | −200 m²s (−191) | 35 (32) |
| Capped, pre-movement 30 s | −57 s (−57 s) | 82.9 m² (68.8) | −932 m²s (−742) | 233 (194) |
| Capped, pre-movement 60 s | −87 s (−87 s) | 208.8 m² (209.5) | −5,833 m²s (−5,406) | 583 (585) |
| Uncapped, pre-movement 0 | +4 s (+4 s) | 0 | 0 | 0 |
0.2 m FDS grid; in brackets the 0.1 m grid. Of the 847 cells with floor, 739 are visited in the capped versions; the others are shown as “not visited” and are outside the five DIFF states.
- Pre-movement shifts min DIFF one for one. It delays everyone by the same constant, so −27, −37, −57, −87 s carry no new information. Only the area and C change shape across the pre-movement versions. A constant delay is a simplification: pre-movement is a distribution whose shape depends on occupancy, warning and management, and in a dense room the first movers set the queue (Purser 2003, pp. 92, 94–97).
- C is Σ DIFF · A over the failing cells, in m²s (paper Eq. 8, without the 20 s bins of Fig. 7 and the release code). The paper’s authors “do not yet have a direct physical interpretation” of it (p. 7). Use it to rank versions.
- The door jambs. The walkable area has 0.8 m deep jambs either side of the door (Setup). They take about 1.4 m² out of the corner where RSET is highest, so the areas here are up to that much smaller than without them.
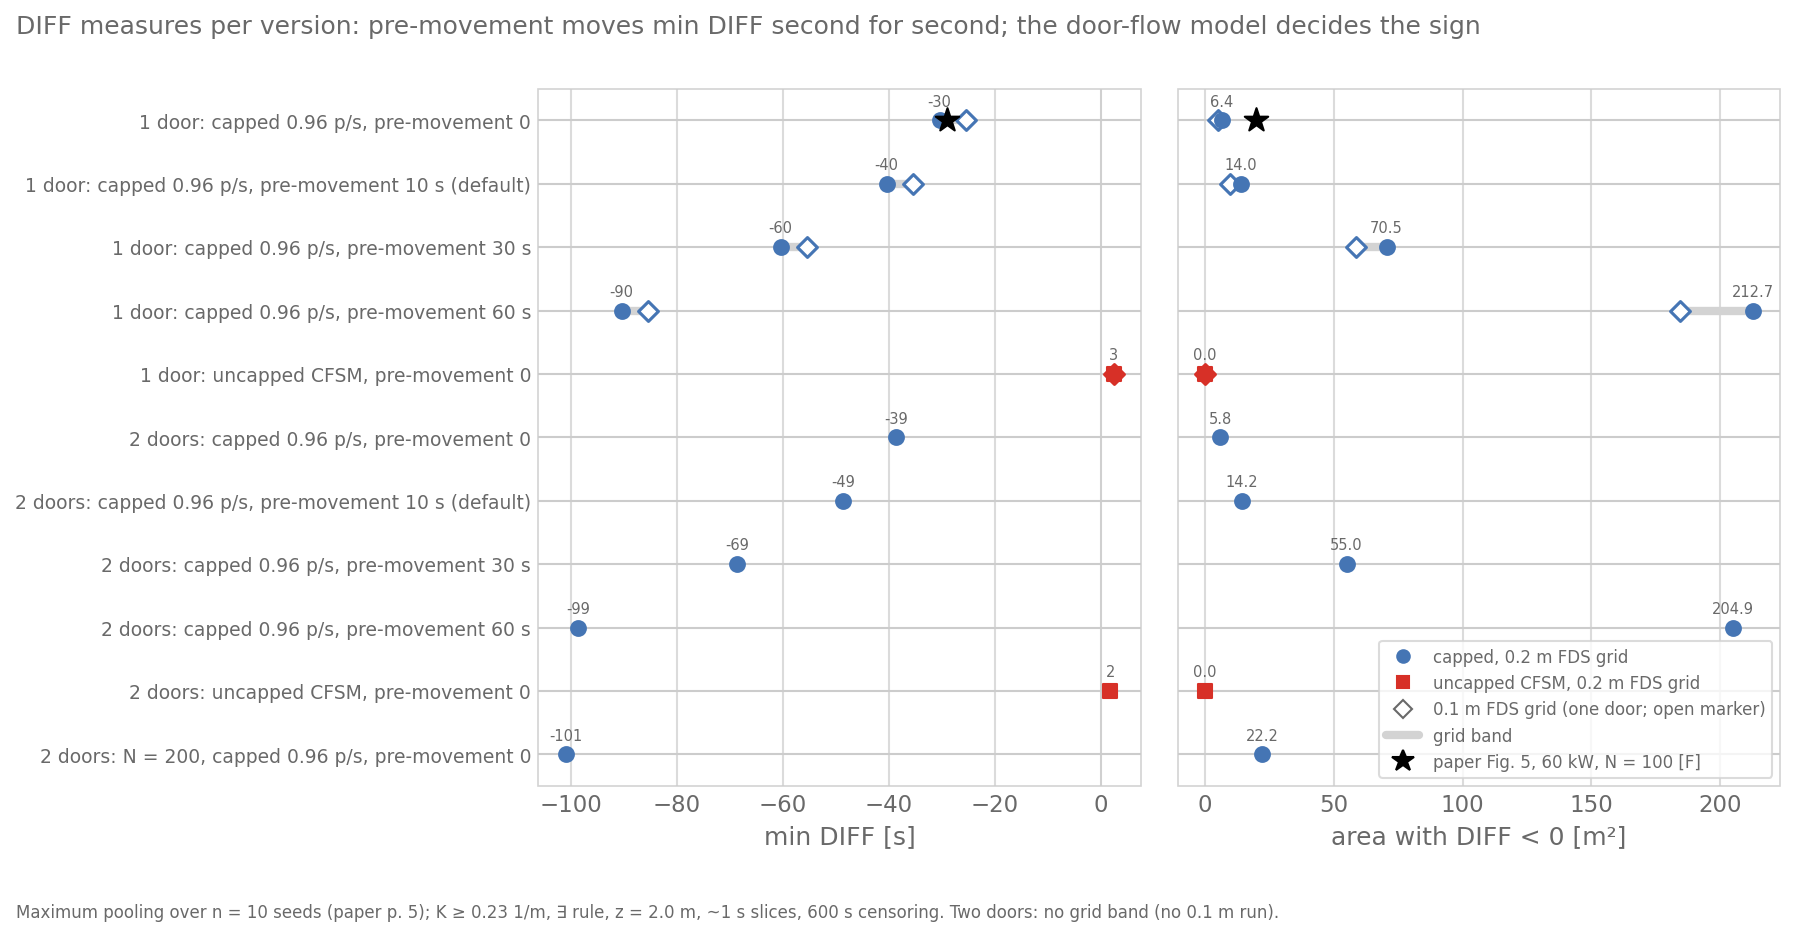
Maximum over n = 10 seeds. Filled: 0.2 m FDS grid; open diamonds: 0.1 m grid; grey bar: the grid band. Two doors: no 0.1 m run, so no grid band.
Two doors
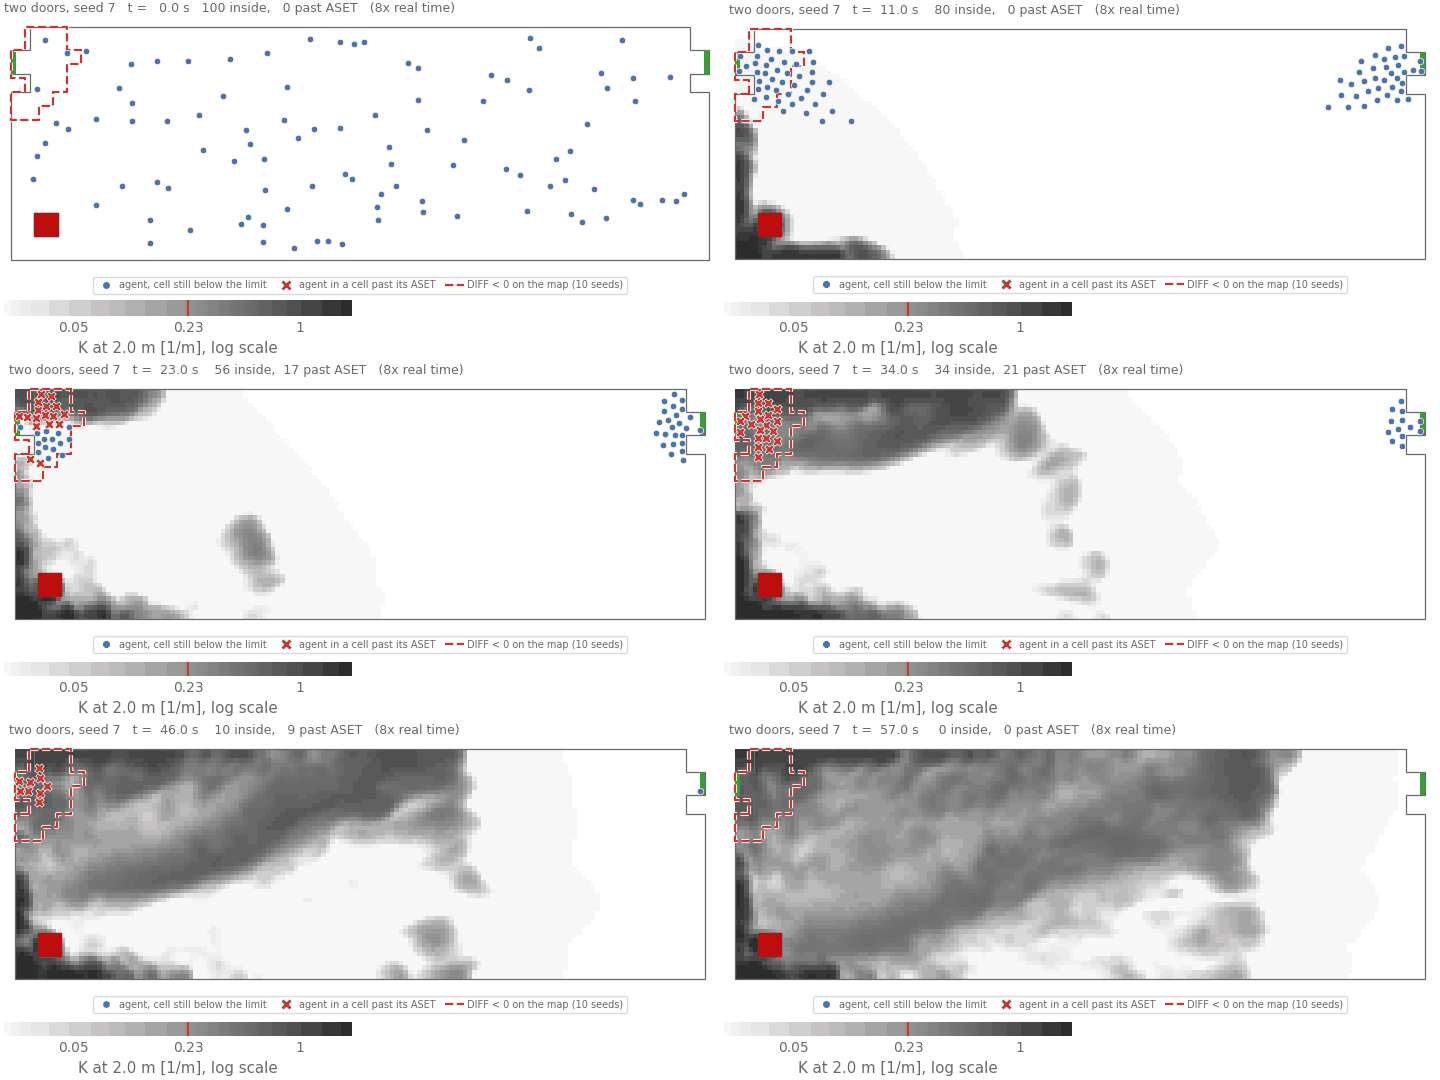
Two doors, capped, pre-movement 0, seed 7 (the seed closest to the median of 53.7 s; its room empties at 54.2 s), 8 times real time. Same encoding as the one-door animation; the outline is the DIFF < 0 area of map (a) below.
From 15 s agents at the west door D2 stand in cells whose ASET has passed, up to 25 of them at 30 s, and from 47 s every agent still inside does. No agent at the east door D1 does. D2, about 7 m from the burner, sets the two-door result.
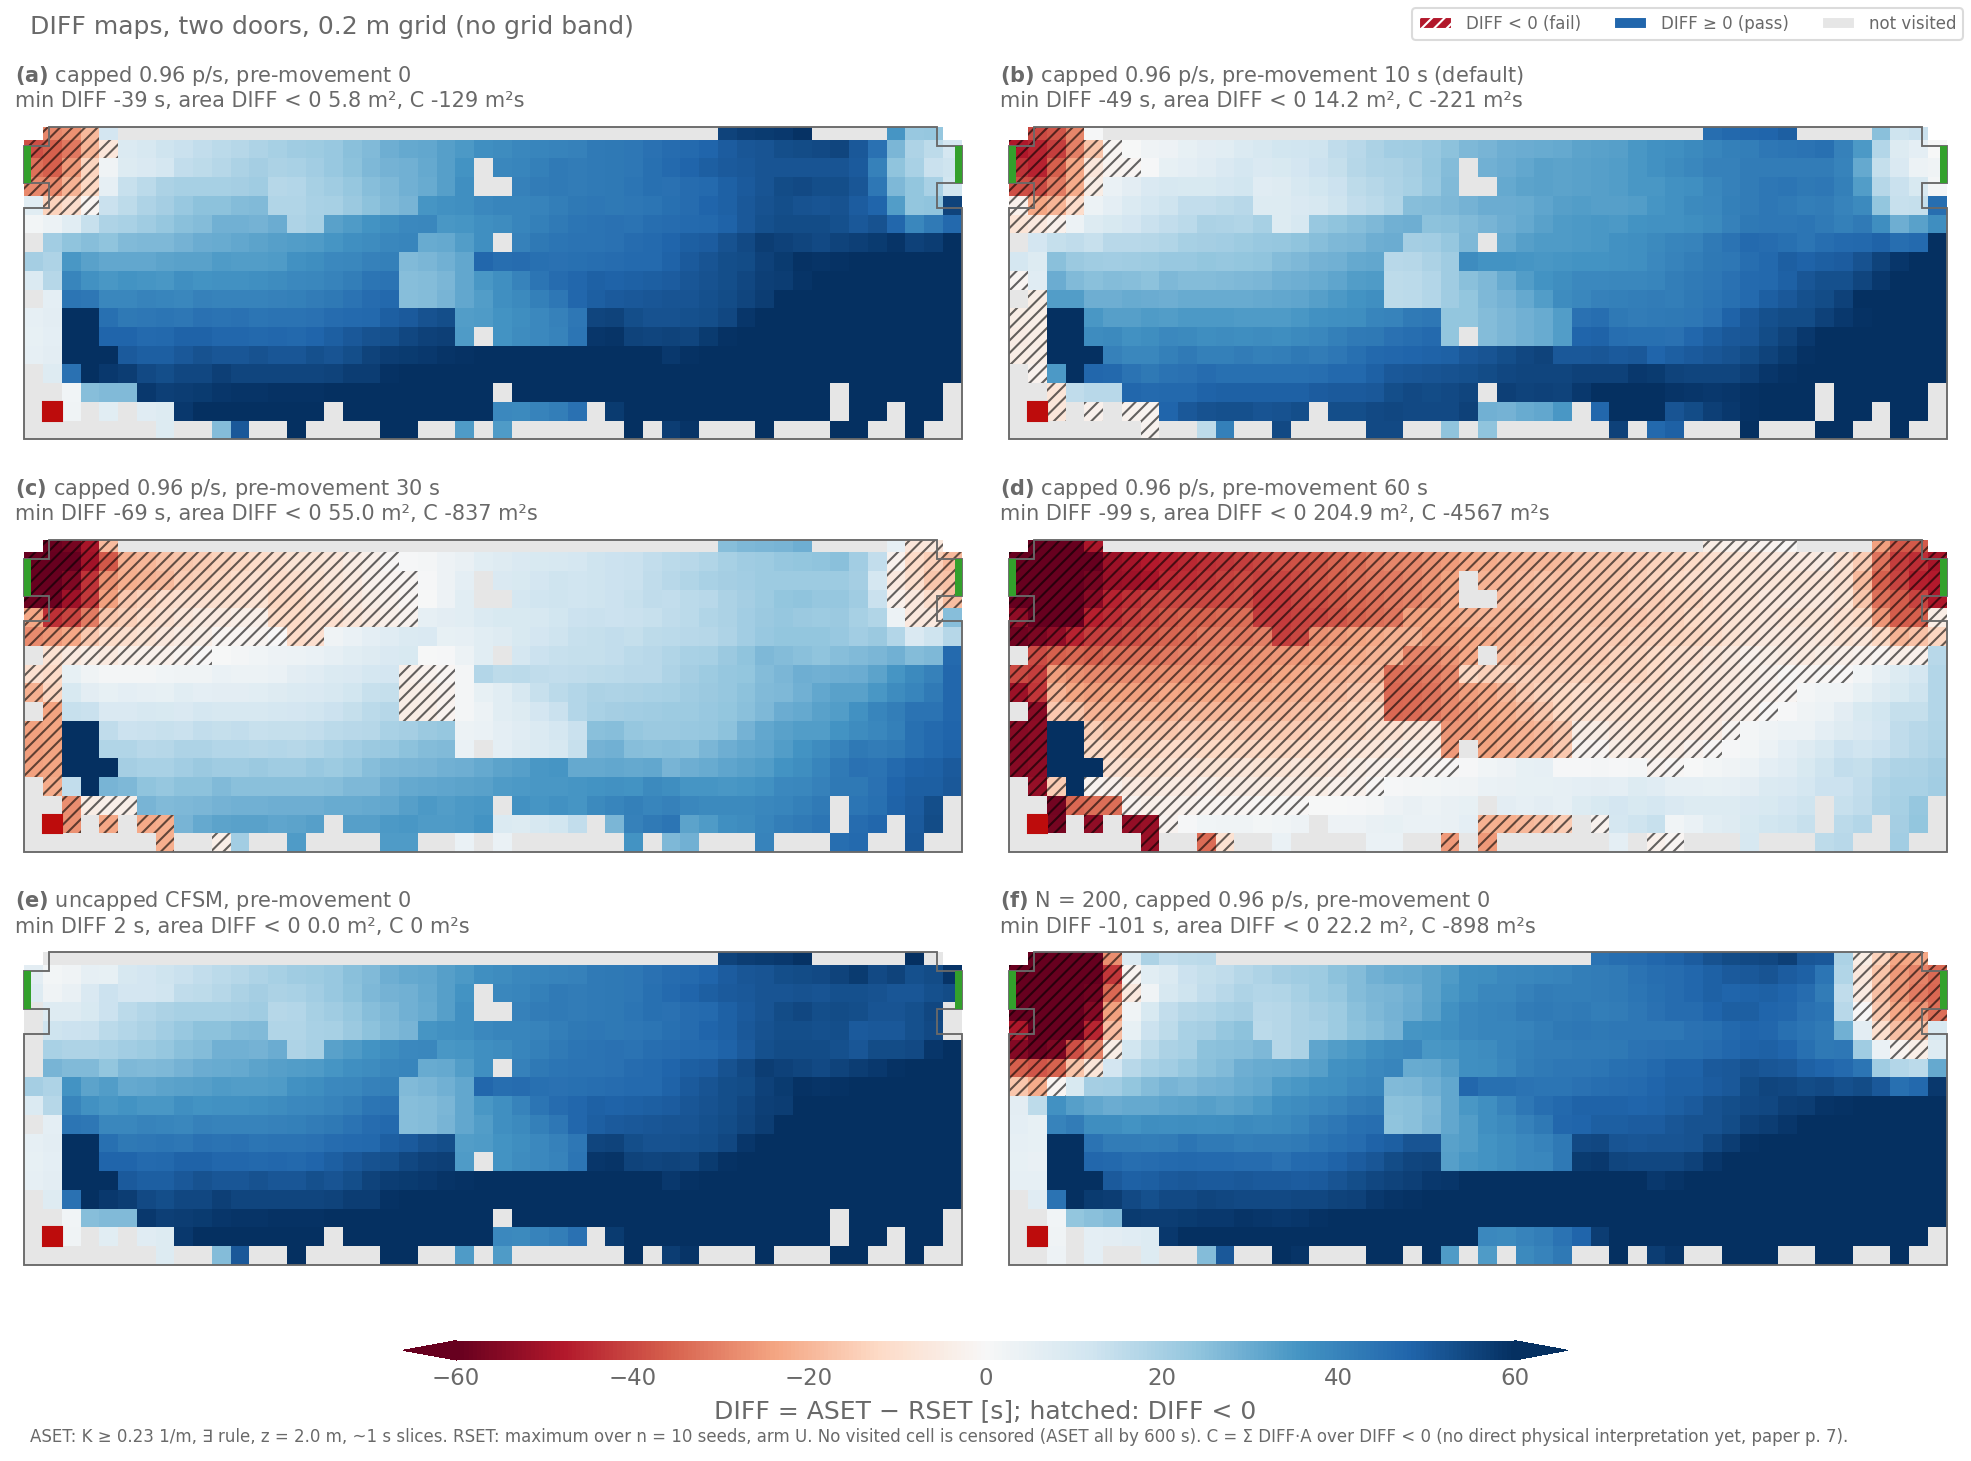
Two doors, 0.2 m FDS grid only: there is no 0.1 m two-door run, so no grid band.
| Two doors, maximum over n = 10 | min DIFF | Area DIFF < 0 | C |
|---|---|---|---|
| Capped, pre-movement 0 | −40 s | 7.4 m² | −174 m²s |
| Capped, pre-movement 10 s | −50 s | 16.2 m² | −277 m²s |
| Capped, pre-movement 30 s | −70 s | 64.2 m² | −1,012 m²s |
| Capped, pre-movement 60 s | −100 s | 210.3 m² | −4,978 m²s |
| Uncapped, pre-movement 0 | −11 s | 2.7 m² | −18 m²s |
| Capped, N = 200, pre-movement 0 | −97 s | 22.9 m² | −962 m²s |
- The second door is our assumption. The paper names no position for it. We mirrored D1 onto the west wall, about 7 m from the burner. Smoke reaches the cells at D2 at 19–29 s, against 69–70 s at D1, so D2 sets every two-door min DIFF.
- Here the uncapped crowd fails too. Its worst cell, at (0.9, 6.9) m on the way to D2, exceeds at 14 s; agents pass it until about 25 s.
- N = 200 tests the paper’s thought experiment. In §3.1 the paper doubles the occupants and adds a second exit, and states that the margin “remains more or less unchanged”. Here N = 200 with two doors gives −97 s against −27 s for one door with N = 100, and the last agent leaves at 102–118 s against 100–101 s. We attribute the difference to our D2 position; we did not run another position. The paper does not report a simulation of this case (“experiment in mind”), so the result neither confirms nor refutes it.
- The split follows shortest paths. The paper assumes shortest-path route choice. We implement it by splitting the spawn area at x = 15 m, so each agent starts with its nearer door. Every agent leaves through the door of its half.
- Seeds split the crowd. Each seed draws the west count from a binomial distribution with the west share of the floor, 0.49335. Over the ten seeds 50.4 % of the agents go west (N = 100) and 51.4 % (N = 200). Seed 10 of N = 200 puts 118 agents west and sets the maximum; the per-seed mean of min DIFF is −82.3 s.
How far to trust the numbers
Six sources of spread, on min DIFF for one door, capped, pre-movement 0:
| Source | Size | How measured |
|---|---|---|
| Seeds | ±0.5 s | 95 % bootstrap CI of the per-seed min DIFF, −26.4 [−26.9, −25.9] s |
| A tiny change of the fire | about 1 s | hrr060 only, same grid, HRRPUA 166.87 against 166.7 kW/m²: −29.9 against −30.9 s |
| FDS grid | under 1 s | 0.2 m against 0.1 m: −27.5 against −26.9 s; area 6.7 against 6.4 m² |
| FDS version against the release | about 5 s on ASET | 10 s ASET maps, ours against the release’s: mean −4.7 s |
| Fire and door setup | about 4 s | release conditions against the paper-only rebuild: −27 against −31 s |
| Door-flow model | about 31 s | capped against uncapped: −27 against +4 s |
The seed spread is small because the cap sets the exit times. With pre-movement 0 the grids agree within one cell on the area; with a 30 s wait they do not (82.9 against 68.8 m²).
Against the paper
- The min DIFF agreement is structural. The worst cell is the last cell before the door, at (29.7, 8.1) m. Its RSET is about N/1.00 ≈ 100 s (measured 101 s), set by the cap; its ASET is 73 s. So −27 s tests when smoke reaches the door, a single cell of the map.
- The −29 s is the paper’s number. It is read off Fig. 5. The release’s
DIFF_map.txthas a minimum of −29 s, but its shape (18 × 51) differs from that ofaset_map.txt(17 × 50), so it cannot come from the released ASET map. - The area is about three times smaller. Ours fails in a compact block
of 21 cells in front of the door; the paper’s Fig. 7 has about 55 failing
elements. The released RSET map (JuPedSim Gompertz model, 1.0 m door,
95th-percentile pooling) has 61, 44 and 24 map elements occupied at or
after 60, 75 and 90 s; ours has 27, 18 and 10 cells (maximum pooling).
The authors’ queue covers about twice the floor area at the same flow,
so it is less dense. That alone would account for most of the gap (our
reading of the release,
1_RSET/RSET_map_all_seeds.txt). - The fire is the authors’. The paper’s text does not state it; the release uses a constant 60 kW on 1 × 1 m. Its Fig. 7 (about 20 m² failing, C about −300 m²s, read off; ours, with 20 s bins: −124 m²s, context only) matches the 60 kW, N = 100 point of Figs. 5 and 8.
Sensitivity to the map rules (one door, capped, pre-movement 0)
| Variant | min DIFF | Area DIFF < 0 | C |
|---|---|---|---|
| Headline: K ≥ 0.23, ∃ rule, about 1 s | −27 s | 6.7 m² | −112 m²s |
| K ≥ 0.23 or T ≥ 45 °C | −27 s | 6.7 m² | −112 m²s |
| K ≥ 0.3 1/m | −27 s | 6.4 m² | −109 m²s |
| Nearest FDS node per cell | −27 s | 6.0 m² | −103 m²s |
| ∀ rule (Eq. 2 as printed) | −26 s | 6.0 m² | −97 m²s |
| ∀ rule, 0.1 m FDS grid | −26 s | 6.0 m² | −93 m²s |
| 10 s steps | −23 s | 5.6 m² | −82 m²s |
| Paper text and release mixed: K ≥ 0.23 or T ≥ 45 (paper text, Fig. 4), nearest node (our reading of the release code), 10 s and 120 s fill (paper §2.2.4) | −21 s | 5.6 m² | −69 m²s |
- ∃ against ∀. The paper’s text (§2.2.3) counts a cell as exceeded when the criterion holds at any data point in it; Eq. 2 as printed reads “for all”. We follow the text (∃); the ∀ rows show the difference. They count a cell as exceeded from the first 1 s step at which every FDS node in it exceeds at the same time.
- The 120 s fill. The paper gives cells that never exceed within 120 s the value 120 s (p. 4). We keep them open (“not by 600 s”). Under the release conditions every cell exceeds by 84 s on both grids, so the fill changes nothing.
Pooling: maximum, 95th percentile and per seed
The paper pools the seeds by the maximum RSET per cell (p. 5), and so do
the tables above. The release code pools by the 95th percentile
(rset_map.py). Two other views, one door, 0.2 m grid:
| Capped, pre-movement 0 | min DIFF | Area DIFF < 0 | C |
|---|---|---|---|
| Maximum over n = 10 | −27 s | 6.7 m² | −112 m²s |
| 95th percentile over n = 10 | −27 s | 6.4 m² | −110 m²s |
| Per seed, mean [95 % bootstrap CI] | −26.4 [−26.9, −25.9] s | 6.1 [5.9, 6.2] m² | −97.4 [−98.7, −96.0] m²s |
With 10 seeds the 95th percentile interpolates between the 9th and 10th values, so it lies close to the maximum. For two doors the views differ more (capped, pre-movement 0): maximum −40 s, 95th percentile −40 s, per-seed mean −30.2 [−34.2, −25.9] s, because the binomial split changes how many agents use D2.
Sensitivity: the room rebuilt from the paper alone
Before we used the release, we rebuilt the room from the paper’s text and
figures only (the hrr060 family): a 1.2 m door at y = 8.2–9.4 m, read off
Fig. 2; a 0.6 × 0.6 m burner at x, y = 0.6–1.2 m with the same 60 kW;
flexible polyurethane foam GM21 (soot yield 0.131, CO yield 0.010,
χr 0.52; SFPE Handbook, 6th ed., App. C, Table C.12, p. 3427); v0 = 1.2 m/s, the paper’s Eq. 6
example; and the exit capped at 0.96 persons/s, read off Fig. 3. The
same evacuation versions run on the current engine:
hrr060, maximum over n = 10 | min DIFF | Area DIFF < 0 | C |
|---|---|---|---|
| One door, capped, pre-movement 0, 0.2 m (0.1 m) | −31 s (−26 s) | 6.2 m² (5.8) | −118 m²s (−92) |
| One door, capped, pre-movement 60 s | −91 s | 213.3 m² | −5,514 m²s |
| One door, uncapped | +2 s | 0 | 0 |
| Two doors, capped, pre-movement 0 | −42 s | 5.8 m² | −132 m²s |
| Two doors, uncapped | −4 s | 0.9 m² | −2 m²s |
| Two doors, N = 200 | −103 s | 21.9 m² | −909 m²s |
The capped crowd leaves 62.5 agents at 40 s and 24.3 at 80 s, and the
last agent leaves at 105–106 s. The door cells exceed at 74–76 s, 2–3 s
later than under the release conditions, and the slower cap empties the
room about 5 s later; together they make min DIFF about 3.4 s lower
(−30.9 against −27.5 s). The
hrr060 fire grid-converges less well: on the 0.1 m grid a late pocket
beside the plume first exceeds at up to 203 s, against 88 s on the 0.2 m
grid, and 6.2 % of cells differ by more than 30 s.
DIFF maps of the paper-only rebuild
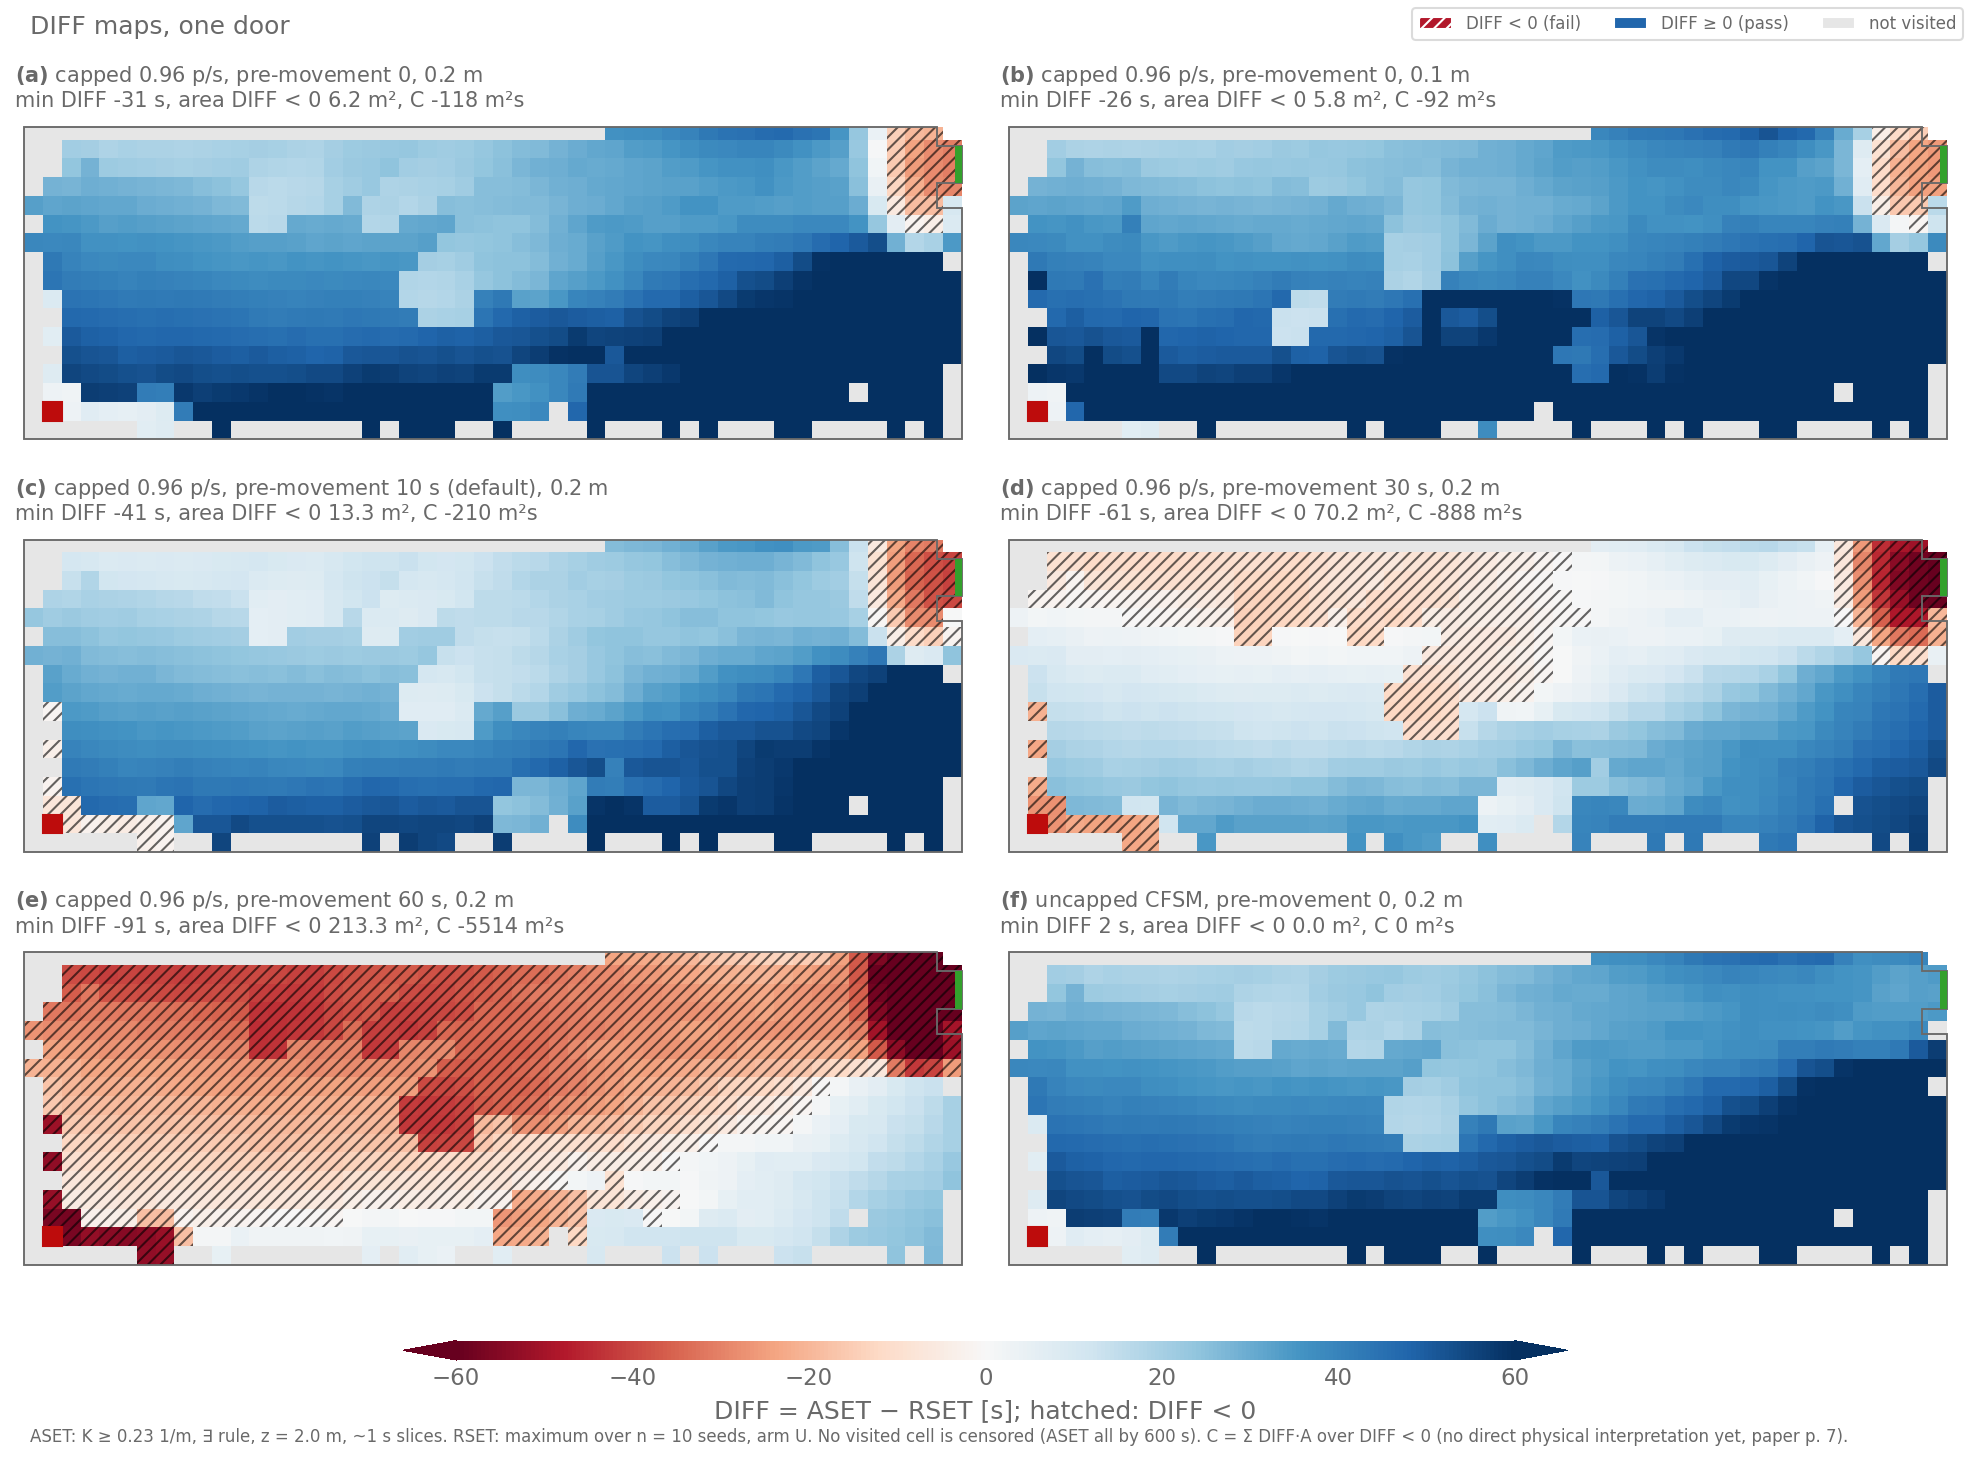
hrr060 family, one door, exit capped at 0.96 persons/s. Same encoding as
the headline DIFF maps.
How the maps are computed
- ASET. FDS writes slices at z = 2.0 m every second. For each criterion, each FDS node gets the first time it holds. A 0.6 m map cell takes the earliest of its nodes (the ∃ rule, the block maximum). The clock starts at ignition; a cell that never exceeds by the FDS end, 600 s, stays open (“not by 600 s”).
- RSET. PedPy
compute_rset_mapwithRsetMethod.MAX: the last frame at which any agent is in the cell, at 10 frames/s, frame 0 at ignition. ASET and RSET share PedPy’s cell edges (asserted). The room is 10 m deep, so the top row is 0.4 m, and every area uses the true cell area. - Pooling. The maximum per cell over n = 10 seeds.
- DIFF on every visited cell, in five states: pass, fail, ≥ bound (ASET not reached), ≤ bound and undetermined (RSET open; empty here, because every run empties the room).
RSET of a cell is travel time plus the modelled pre-movement, counted from ignition, with no detection or alarm time, and it is the last time anyone is in that cell. ISO/TR 16738, Eq. 2, defines RSET for a whole building as the sum of detection, alarm, pre-movement and travel times.
The agents ignore the fire, as in the paper’s method: “there is no
inherent need to couple the fire and evacuation models … the coupling is
solely conducted when analysing the model output” (§1). All runs use
arm U: --smoke-blind --disable-tenability --smoke-slice-height 2.0 (see
Usage). The trajectories are identical on the 0.2 m and the
0.1 m FDS output for all 50 one-door runs (asserted), so one RSET set per
door layout serves both grids. Smoke feedback on speed and route choice
lies outside this study.
Reproduce
The FDS decks, the scenarios and their generators are in
assets/schroeder2020_room/. The FDS output and the authors’ release are
not in the repository. Copy each rel_* folder into a folder DATA
outside the repository and run FDS 6.10.1 in it, for example
(cd DATA/rel_1door && mpiexec -n 6 fds rel_1door.fds). Then, with an
empty folder RUNS outside the repository and, for the comparison with
the release, the unpacked release in RELEASE:
uv run --with "pedpy>=1.5.1" python scripts/docs/schroeder_room_maps.py \
    --data DATA --runs RUNS --family rel --release RELEASE
Without --release it skips the comparison with the release. It runs the
160 evacuations (existing ones are reused), checks that every agent
leaves, prints every number on this page as Markdown tables, and writes
the figures to site/static/images/studies/schroeder2020/. It needs
PedPy ≥ 1.5.1 for compute_rset_map. --family hrr060 with its own
RUNS folder gives the paper-only rebuild; it prints all its tables and
writes only the figure this page uses, hrr060/diff_1door.png.
The animations and the grid figures come from two further scripts, run after it on the same folders:
uv run --with "pedpy>=1.5.1" python scripts/docs/study_animations.py \
    schroeder --data DATA --runs RUNS --family rel
uv run python scripts/docs/schroeder_grid_figures.py --data DATA \
    --cache RUNS/cache --family rel
grid_perturbation.png comes from the same grid script with
--family hrr060.
Provenance. The evacuation runs on this page were made at 4a7142f, a
branch commit that is not on main; its pyfds_evac/ equals main at
100e91d. Each run’s manifest records that commit with git_dirty: false
and agent_seeding: spawn-key-blake2b-v2. A re-run of all 160 evacuations
on main at 449a755d, and again at 9c820e0f (Python 3.12.13, through
the release check, release_check.sh --full --only study-schroeder2020), prints the
same values for the headline, so cite 9c820e0f. When the code
changes, re-run the command into a new RUNS folder and compare the
printed tables with this page.
Setup, deviations and caveats
Every input, with its source
Tags: [P] stated in the paper, [F] read off a paper figure, [R] taken from the authors’ release (doi:10.5281/zenodo.3875550), [A] assumed.
| Item | Value | Tag |
|---|---|---|
| Room | 30 × 10 × 3 m, one door, no other openings | [P] §2.1; [R] |
| Door D1 | east wall, y = 8–9 m (1.0 m), 2.0 m high, OPEN vent | [R] |
| Door D2 (two doors) | west wall, y = 8–9 m, D1 mirrored about x = 15 m | [A] |
| Fire | HRRPUA 60 kW/m² on a 1 × 1 m floor vent at x, y = 1–2 m: 60 kW, no ramp given (FDS default onset) | [R] |
| Reaction | polyurethane, C=6.3, H=7.1, O=2.1, N=1.0, SOOT_YIELD=0.129 (NFPA Babrauskas); no CO yield, heat of combustion or radiative fraction set, so the FDS defaults apply (no CO, χr 0.35) | [R] |
| Smoke | mass extinction coefficient 8,700 m²/kg, the FDS default | [R] (unset) |
| Irritants, HCN | none tracked | [R] |
| FDS | 6.10.1, 0.2 m cells (0.1 m grid check) in six 5 m meshes along x, 600 s, slices every 1 s at 1.0, 1.6 and 2.0 m | 0.2 m [P], [R]; rest [A] |
| Occupants | 100 (200 for N200), all placed at t = 0, uniform over [0.3, 29.7] × [0.3, 9.7] m without the burner corner [0.3, 2.2]² | N [P] §2.1; area [R]; corner [A] |
| Pre-movement | 0 [P]; 10 s (default), 30 s, 60 s constant | [P] / [A] |
| Model | collision-free speed model, r = 0.15 m, v0 ~ N(1.3, 0.1) m/s, clipped to 0.1–5.0 m/s by the engine | v0 [R]; model and r [A] |
| Exit cap | 1.00 persons/s per exit, measured from the release’s ten runs over 10–90 % of agents | [R] |
| Exits | E1 [29.8, 30] × [8, 9], E2 [0, 0.2] × [8, 9] | [R] / [A] |
| Door jambs | 0.8 m deep, in the walkable area only | [A] |
| Two-door split | per seed, binomial with the west floor share 0.49335 | [A]; implements the paper’s shortest-path route choice |
| Seeds | 1–10 | n = 10 [P] p. 5 |
Deviations from the release
- FDS version and meshes. FDS 6.10.1 instead of 6.5.3; six meshes instead of one, with the same 0.2 m cells. Neither the burner nor a door crosses a mesh interface.
- Time and output. 600 s instead of 120 s, slices every 1 s instead of every 10 s, and more quantities and heights. Cells unexceeded by 600 s are censored instead of filled with 120 s.
- Slice to map. Each 0.6 m cell takes the earliest of its FDS nodes; the release resizes the slice with PIL, which smooths the field.
- Evacuation model. The collision-free speed model with a capped exit instead of the Gompertz model; a circle of radius 0.15 m instead of ellipses with semi-axes 0.18 and 0.25 m; uniform random spawns instead of a lattice.
- RSET sampling. Trajectories at 10 frames/s and PedPy cells; the release writes 1 frame/s and maps to the nearest node of a 51 × 18 grid. At 1 frame/s the release breaks its own Eq. 6 (Δt ≤ w/v_max = 0.5 s).
- Map rules. The release ASET uses extinction only
(
quantities = {'extinction':0.23}inaset_map.py), pools RSET by the 95th percentile (rset_map.py), and counts DIFF = 0 as a fail (the lastnp.histogrambin is closed). We follow the paper’s text: K ≥ 0.23 1/m, the maximum, DIFF = 0 passes. - Door jambs, 0.8 m deep, in the walkable area only. We keep them by decision; they cost about 1.4 m² of floor at the door. FDS has no jambs, as in the release. In a clear-air check (capped, pre-movement 0, seeds 1–10) every agent is last recorded inside the passage, at x ≥ 29.65 m and y = 8.16–8.84 m. With the exit drawn flush with the wall instead, 77 of 1,000 agents are last recorded up to 0.03 m beyond the door edges (y = 7.97–9.03 m), and the agents left at 40 and 80 s change by 0.1.
- D2, N = 200 and the pre-movement sweep exist only in our runs.
- One-door and two-door rooms are separate FDS runs, so the ventilation differs as well as the egress.
Caveats on the comparison with the release
- Soot and heat of combustion in FDS 6.10.1. From the same reaction line, FDS 6.10.1 computes a heat of combustion of 18,075 kJ/kg, the release’s FDS 6.5.3 17,993 kJ/kg (+0.46 %). The default hydrogen fraction of soot changed from 0.1 (6.5.3) to 0 (6.10.1, pure carbon), which changes the stoichiometry. At the same HRR our fire therefore burns 0.46 % less fuel and makes 0.46 % less soot. We keep the 6.10.1 default, as the release keeps the 6.5.3 default.
- K at 2.0 m is higher than the release’s from 50 s on, by 0.03–0.05 1/m on average, so our ASET map is earlier there. The cause is not established. The FDS version (with extinction model 1 against 2, ambient water vapour mass fraction 0.00594 against 0.00515) and the mesh decomposition both differ; the soot change acts the other way.
- HRR. The release’s FDS
.outfile shows 68.9 kW at its last time step. That is an instantaneous value (time step 0.9 ms at 120 s): the release’sASET_animation_hrr.csvaverages 60.0 kW over 10–120 s and over 110–120 s, as does ours (60.00 kW over 10–120 s and over 120–600 s). - Agents also spawn in the door passage. The spawn area includes the passage between the jambs, so our first agent leaves within 2 s (last recorded at 0.4–1.9 s), the release’s at 1–3 s. In a clear-air check, excluding the passage from the spawn area moves the first exit to 0.7–1.9 s and the count left at 40 s from 60.5 to 60.6.
- No CO. The release sets no CO yield, so the FDS default of zero applies. The CO criteria and the CO term of the FED do not apply; the gas FED holds only CO₂ and O₂.
- Radiative fraction 0.35, the FDS default; the release does not print it, and we assume the 6.5.3 default is the same.
Grid
The characteristic fire diameter at 60 kW is D* ≈ 0.31 m, so D*/δx = 1.56 at 0.2 m and 3.1 at 0.1 m, and H/D* = 9.6. The FDS User’s Guide (§6.3.6) warns against taking any tabulated D*/δx as an acceptable minimum. Under the release conditions the two grids agree closely: min DIFF within 1 s, the door-region ASET within 3 s, and the area within 0.3 m² without pre-movement. With a 30 s wait the areas differ (82.9 against 68.8 m²), so both grids are given.
The FDS device trees stand at cell centres on both grids: at (5.1, 5.1), (15.1, 5.1) and (25.1, 8.5) m with points at z = 0.1–2.9 m on the 0.2 m grid, and at (5.05, 5.05), (15.05, 5.05) and (25.05, 8.55) m with points at z = 0.05–2.95 m on the 0.1 m grid. None lies on a mesh interface. The maps use only the slices; the trees give the layer profiles below.
Grid figures: the smoke layer and a same-grid perturbation
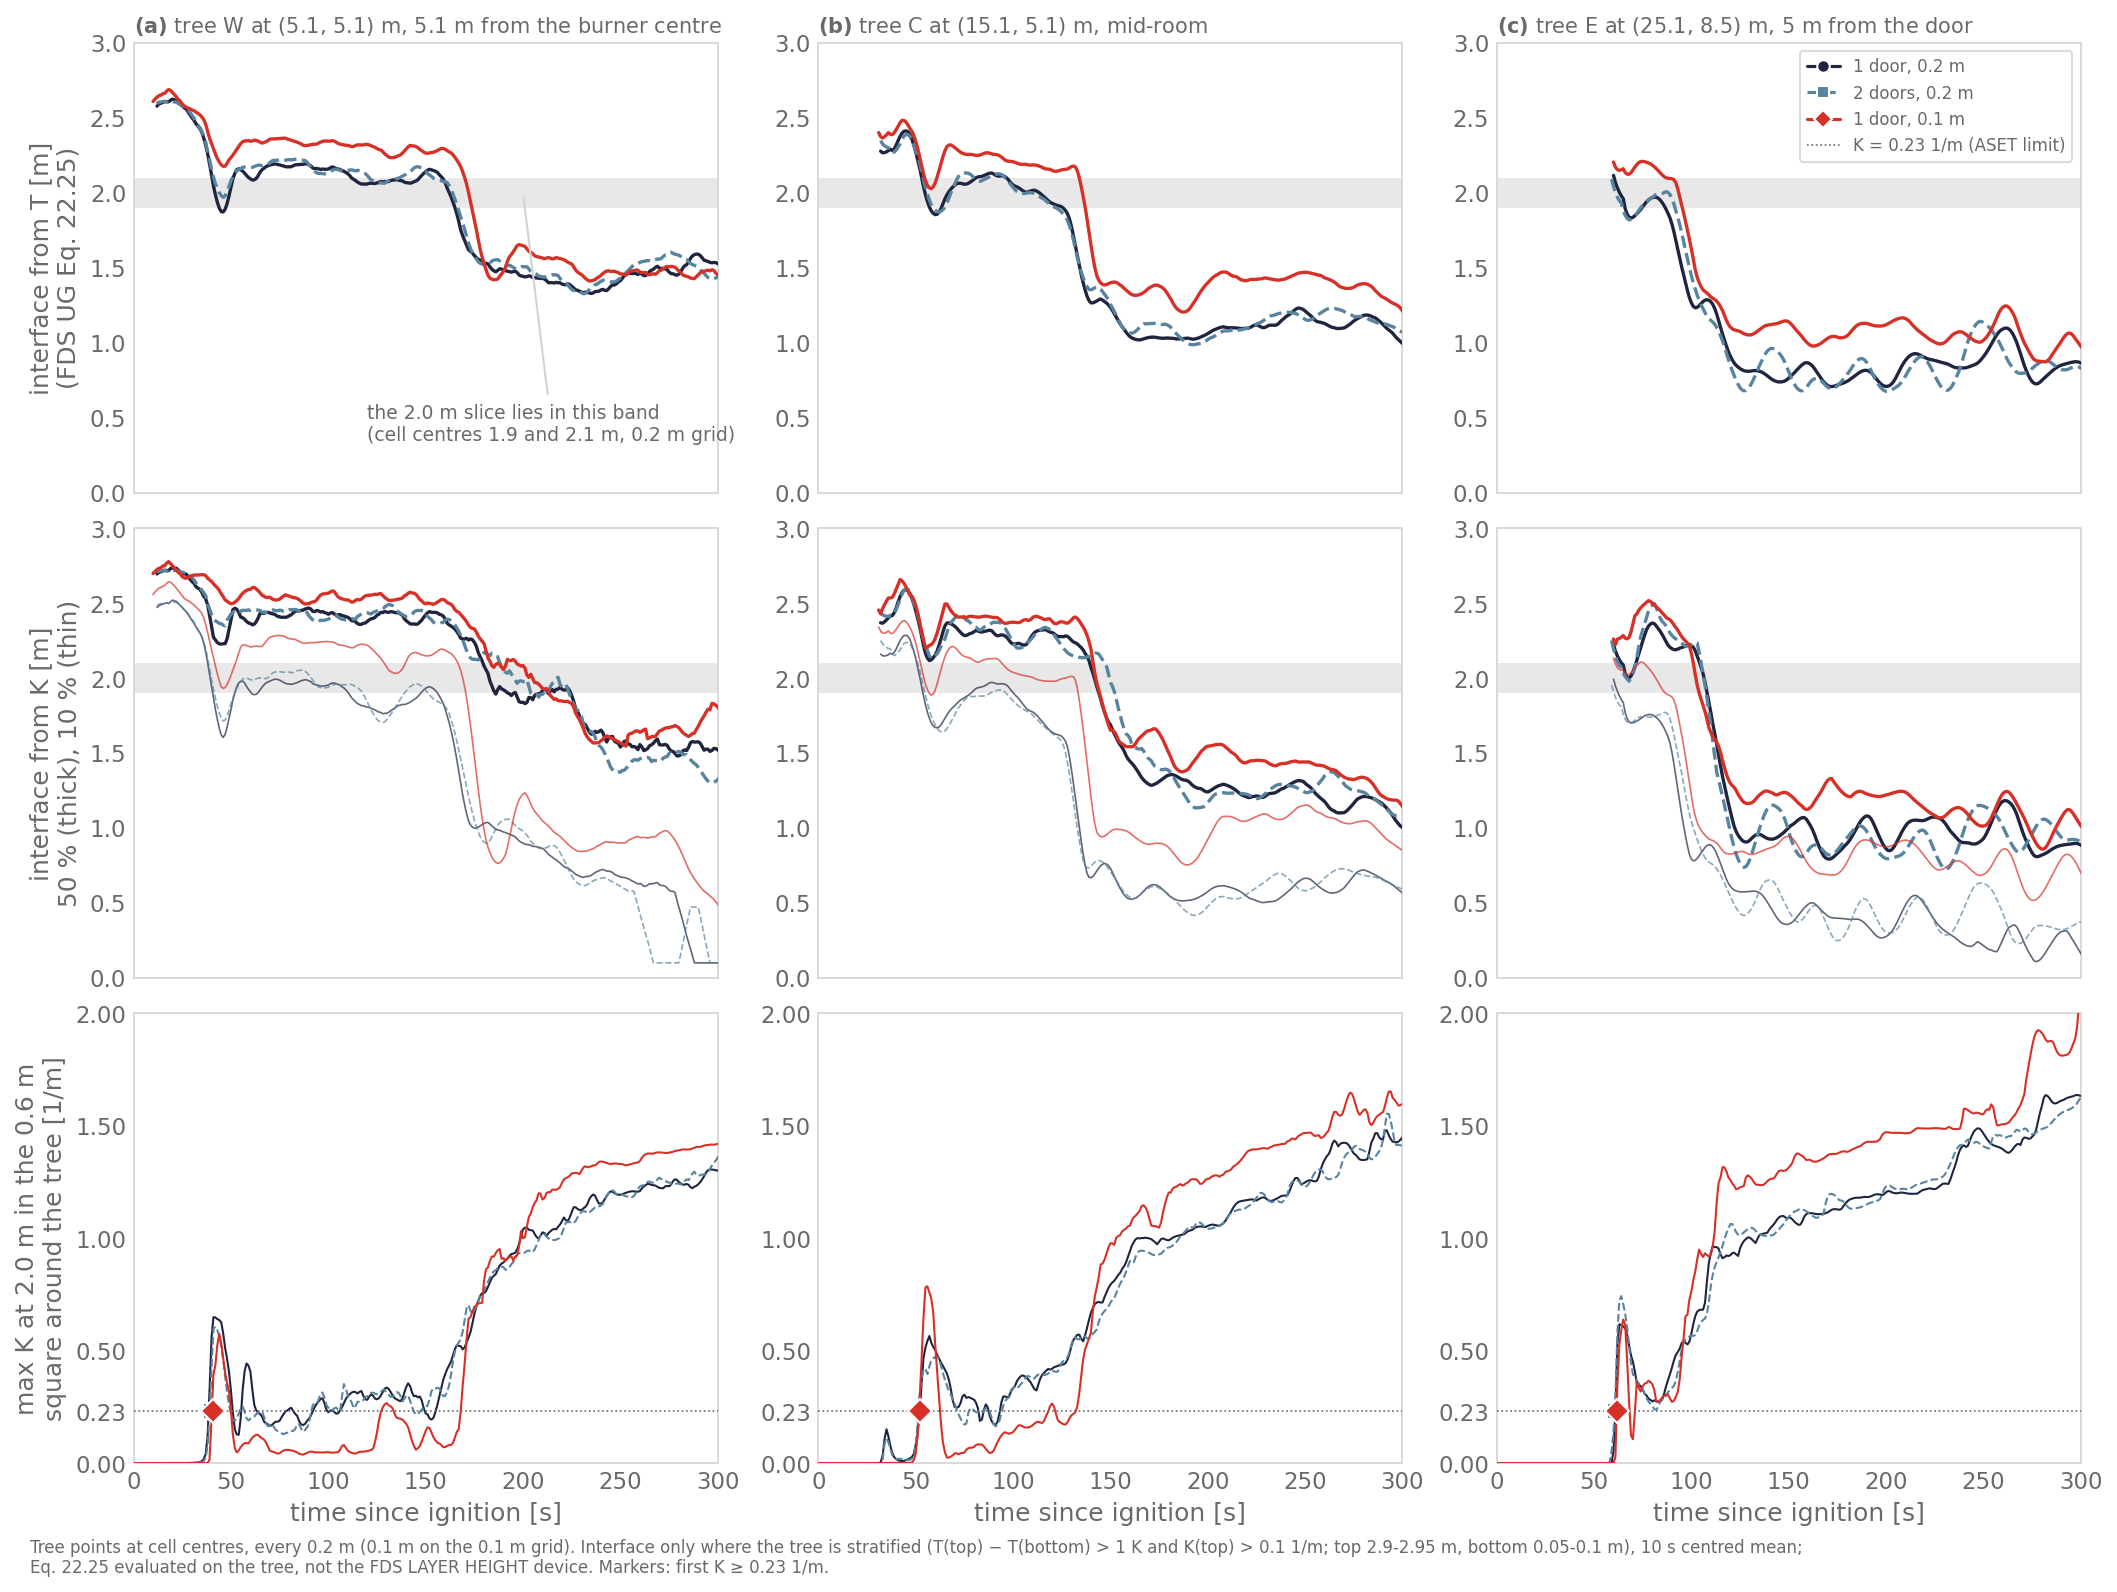
The smoke layer at the three device trees, release conditions. Top: the
interface height from temperature (FDS User’s Guide Eq. 22.25, evaluated on
the tree). Middle: the height where K falls to 50 % (thick) or 10 % (thin)
of its column maximum. Bottom: the largest K at 2.0 m in the 0.6 m square
around the tree, with its first crossing of 0.23 1/m. Regenerated by
scripts/docs/schroeder_grid_figures.py.
The temperature-based interface comes down through 2.0 m for the last time at 162–172 s at tree W, 109–135 s at tree C and 63–93 s at tree E. Until then the 2.0 m slice sits just below the interface, where K changes steeply with height, so a small shift of the layer moves the first crossing. The first crossings of 0.23 1/m agree within 2 s between the grids at all three trees (39–41 s at W, 52–53 s at C, 61–62 s at E). After the first crossing K at tree W dips below the limit again, for 5 s on the 0.2 m grid and for 77 s on the 0.1 m grid; ASET counts the first crossing, so the dip does not change the map.
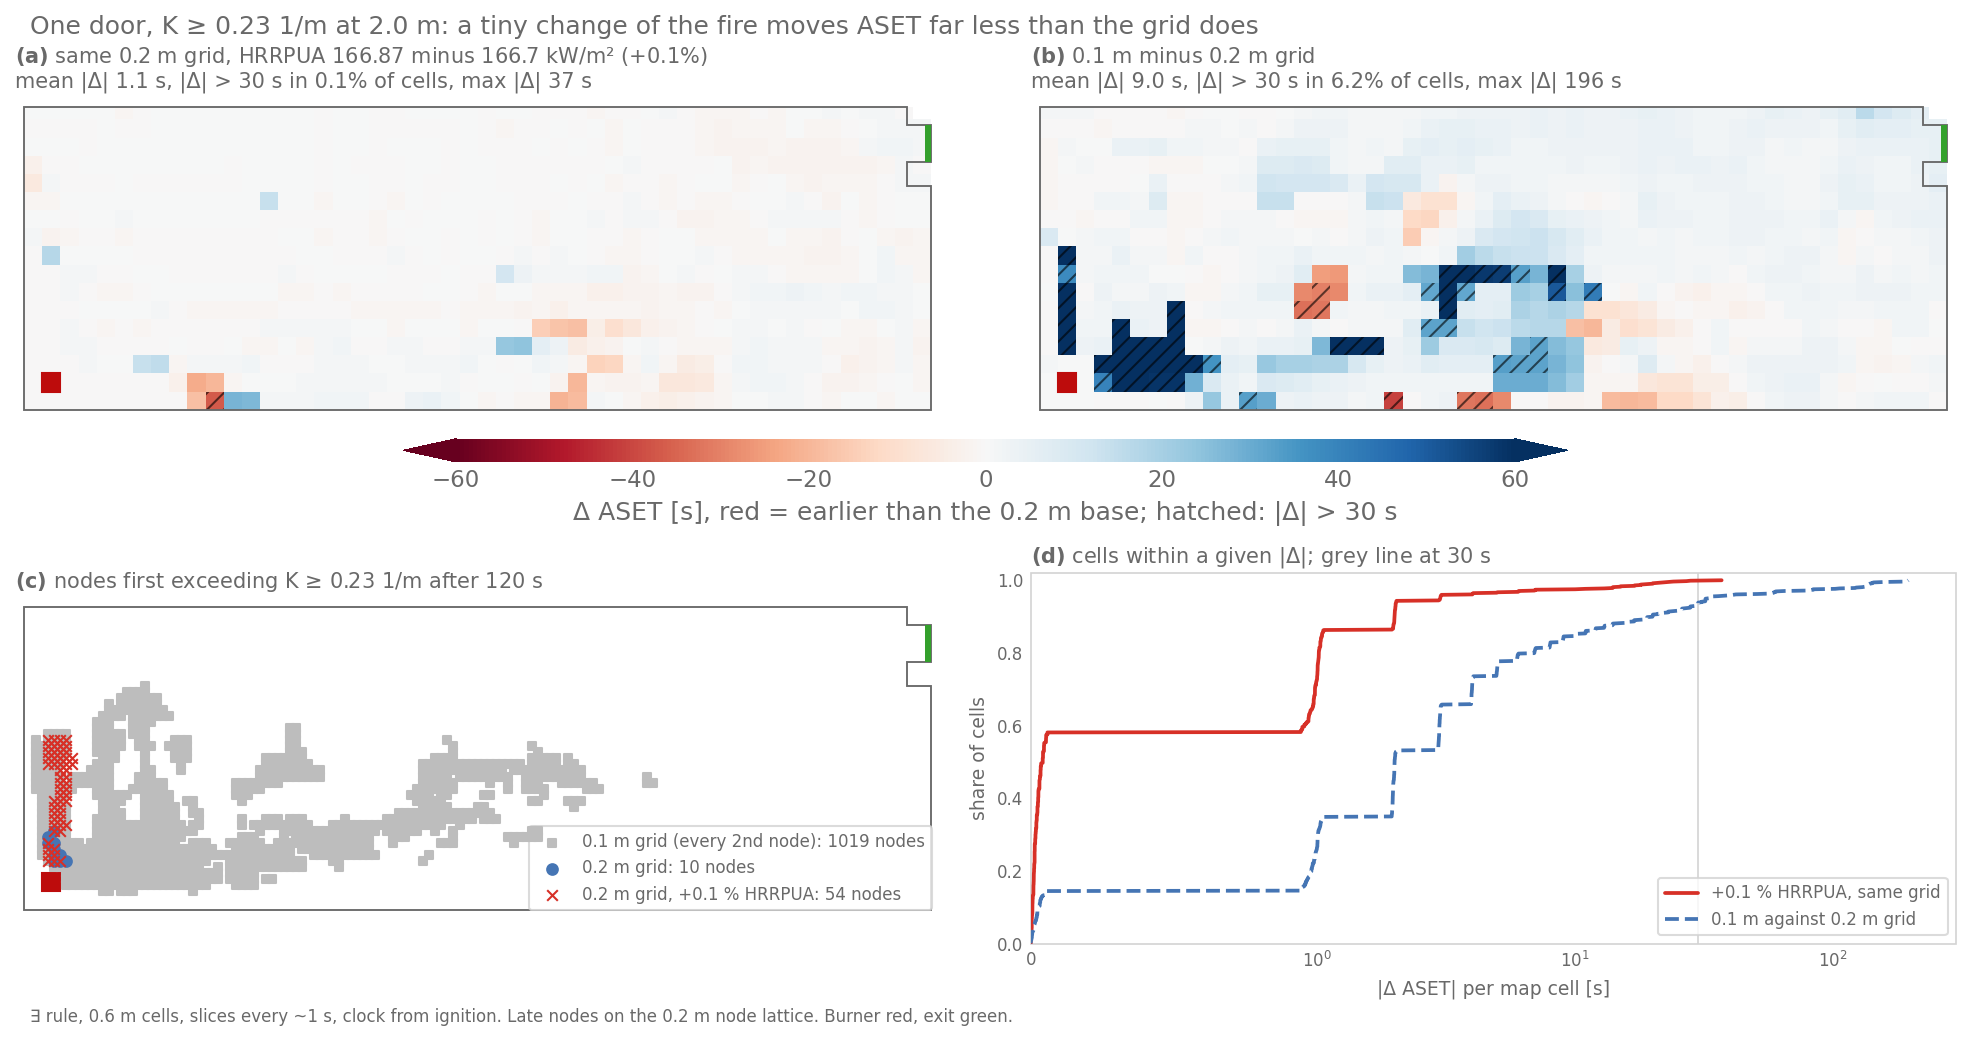
Paper-only rebuild (hrr060), one door, K ≥ 0.23 1/m at 2.0 m, the ∃
rule on the page’s 0.6 m cells. hrr060_1door_pert is the one-door 0.2 m
deck with HRRPUA raised by 0.1 % (166.87 instead of 166.7 kW/m²) and
nothing else changed. The release family has no perturbed run.
Regenerated by scripts/docs/schroeder_grid_figures.py --family hrr060.
In the paper-only rebuild, a 0.1 % change of the fire on the same grid
moves ASET by 1.1 s on average, and its late nodes stay in a strip beside
the burner. The 0.1 m grid moves ASET by 9.0 s on average and puts a wide
band of late nodes over the western two thirds of the room (x up to
20.8 m). That late band is therefore a grid effect of the 0.6 m burner;
the release burner has none. The hrr060 device trees lie on cell faces
(z = 0.2–2.8 m, and x, y = 5.1, 15.1, 25.1 / 5.1, 8.9 m on the 0.1 m
grid).
Limits and open issues
- Not modelled here: smoke slowing agents or changing their route, and signs losing visibility. Both are open questions for the built-in maps (#210). Sign visibility is a wayfinding map and never enters DIFF (#140).
- Pre-movement is a constant here, as in the paper. A distributed pre-movement per person is the next scenario for this room.
- Engine issues that touch this study: exit throttling has no test (#355). Fixed since the earlier version: an agent leaves when its centre is within 0.03 m of the exit polygon (#349, #401); the initial exit is ranked from each agent (#350), although the room keeps two spawn areas split at x = 15 m; the smoke-blind arm (#341) and the guard against sampling past the FDS end time (#340) are in place.
- One room, one fire. The paper’s other combinations of HRR and N were not run.
Sources
Sources
- Schröder, B., Arnold, L., & Seyfried, A. (2020). A map representation of the ASET-RSET concept. Fire Safety Journal, 115, 103154. doi:10.1016/j.firesaf.2020.103154. Version-of-record pages: Eqs. 1–3, 0.23 1/m, 2 m and 0.6 m p. 3; the 120 s fill, Eq. 4 and 45 °C (Fig. 4) p. 4; Eq. 5 and pooling p. 5; Eq. 7 and the note on individual exposure p. 6; the two-exit thought experiment (§3.1), Fig. 5 and Eq. 8 p. 7; Figs. 6–8 p. 8. Pages 3, 7 and 8 are checked against the version of record; the others against the journal pre-proof only.
- Schröder, B., Arnold, L., & Seyfried, A. (2020). A Map Representation of
the ASET-RSET Concept – Reference Implementation (v1.0.1). Zenodo.
doi:10.5281/zenodo.3875550.
Cited in the paper as [35] (version of record p. 3). We use its FDS input
and output (
0_ASET/HRR_60kW: deck,.out,ASET_animation_hrr.csv; extinction slices;0_ASET/aset_map.txt), its JuPedSim input, geometry and trajectories (1_RSET/12??/corridor_ini.xml,corridor_geo.xml,corridor_traj.xml), the released RSET and DIFF maps and the three analysis scripts. Our figures draw its ASET map and agents-remaining curves for comparison. - vfdb (2020). Leitfaden Ingenieurmethoden des Brandschutzes, TB 04-01, §8.1 (p. 312); §8.2 Eq. 8.1 (p. 313); §8.4 (p. 319); section “8.6 Anhaltswerte zur Beurteilung der Personensicherheit” (pp. 323–325) with Table 8.3 and notes 2–6 (p. 325), and Fig. 8.4 (pp. 326–327). The Leitfaden prints two sections numbered 8.6; its table of contents lists only “8.6 Rauchausbeuten”. Paraphrased.
- DIN 18009-2:2022-08, §7.2.1–7.2.3, Table 1 (pp. 22–24). Paraphrased. Table 1 heads the long column “(> 30 min)”, where vfdb Table 8.3 has “(< 30 min)”; we have not resolved which is intended.
- Engineers Australia Society of Fire Safety (2014). Practice note for tenability criteria in building fires, version 2.0, §5 (p. 13), §5.2 and Fig. 8 “Short Exposure” (p. 15; a second Fig. 8, “No Exposure”, is on p. 13), §5.3 (p. 17). Full reference on ASET and RSET.
- MBIE (2025). C/VM2 Verification Method: Framework for fire safety design, 2nd edition, §2.1.6.1–2.1.6.3 (p. 17), with Building Code clauses C4.3 and C4.4; and MBIE (2012), Commentary for Verification Method C/VM2, pp. 29, 47, 49. Full references on ASET and RSET.
- ISO 13571:2012, §3.1, §4.2, §4.4, §4.6 f, §5.4, §8.2–8.5 (§8.3.1 Eq. (9)), clause 9 and A.5.2; ISO/TR 16738:2009, §5.7 Eq. (2). Paraphrased; see Incapacitation thresholds.
- Purser, D. A., & McAllister, J. L. (2026). Assessment of hazards to occupants from smoke, toxic gases, and heat. SFPE Handbook of Fire Protection Engineering, 6th ed., Ch. 70, pp. 2271–2352. Eqs. 70.7 and 70.41, Tables 70.3, 70.4 and 70.18; pp. 2284–2285, 2288, 2310, 2318–2319, 2322, 2340. doi:10.1007/978-3-031-59212-6_70
- Wood, P. G. (1972). The Behaviour of People in Fires. Fire Research Note No. 953, Fire Research Station, Borehamwood. No DOI or public URL.
- Bryan, J. L. (1977). Smoke as a Determinant of Human Behavior in Fire Situations (Project People). NBS-GCR-77-94, University of Maryland, for the National Bureau of Standards. NTIS PB271755, ntrl.ntis.gov.
- Hartzell, G. E., & Emmons, H. W. (1988). The fractional effective dose model for assessment of toxic hazards in fires. J. Fire Sci., 6, 356–362. doi:10.1177/073490418800600504
- Gann, R. G., et al. (2001). International study of the sublethal effects of fire smoke on survivability and health (SEFS): Phase I final report. NIST TN 1439. doi:10.6028/NIST.TN.1439
- Babrauskas, V., Fleming, J. M., & Russell, B. D. (2010). RSET/ASET, a flawed concept for fire safety assessment. Fire Mater., 34, 341–355, pp. 347–348, 350–351. doi:10.1002/fam.1025
- Purser, D. A. (2003). ASET and RSET: addressing some issues in relation to occupant behaviour and tenability. Fire Safety Science, 7, 91–102, pp. 92, 94–97. doi:10.3801/IAFSS.FSS.7-91
- Węgrzyński, W., Spodyniuk, N., Zimny, M., Jahn, W., Vigne, G., & Arnold, L. (2026). Tenability criteria in performance-based fire safety engineering: practitioner’s perspectives from a global survey. Fire Saf. J., 165, 104938. doi:10.1016/j.firesaf.2026.104938
- SFPE Handbook of Fire Protection Engineering, 5th ed., App. 3, Tables A.38 and A.39 (fuel yields of flexible polyurethane foam GM21, used in the paper-only rebuild). The same GM21 row is in the 6th ed., App. C, Table C.12 (p. 3427).
- McGrattan, K. et al. Fire Dynamics Simulator User’s Guide, sixth edition, NIST SP 1019, §6.3.6.
- The original FDS+Evac,
for
PRE_MEAN. - Code:
pyfds_evac/core/fed.py(gas and heat FED rates),pyfds_evac/core/scenario.py(exit throttling),pyfds_evac/core/direct_steering_runtime.py(EXIT_REACH_TOLERANCE_M),pyfds_evac/core/run_config.py(--smoke-blind),pyfds_evac/core/simulation_init.py(_apply_default_premovement).
What next
- ASET, RSET and the egress timeline: the classic single-point comparison this page maps.
- A crowd in a fire: per-agent exposure and a location ASET map on an FDS fire.
- RSET from an ensemble of seeds.
- Visibility through smoke, Fractional effective dose, Heat.
pyFDS-Evac is research software, provided without warranty.