A crowd in a fire
This page runs a larger case end to end: 150 people try to leave a T-shaped corridor while a 2 MW PVC fire, computed by FDS, fills it with smoke. Each step shows the command and what it produces.
It builds on the Quickstart (one agent, prescribed smoke) and the Real-FDS walkthrough (small tracked FDS cases). Unlike those, it needs FDS output that you compute with FDS on your own computer; step 3 shows how.
Download the files for this page (32 kB zip)
Before you start
Run every command on this page from one of:
- the repository root, in the environment installed with
uv sync; - the unpacked zip above, with the packages of its
requirements.txtinstalled. Run the commands withpythoninstead ofuv run python.
1. Check the scenario runs
Without FDS output the example runs the scenario in clear air, in about 5 s:
uv run python examples/first_fds_case.pyThe last line of the output is:
evacuated: 144/150 in 300 s2. The scenario
The scenario is a folder, assets/t_junction: a JuPedSim config.json and
the walkable area as geometry.wkt. It sits beside the FDS deck that made its
fire. pyfds-evac init assets/t_junction/t_junction.fds derives the same
150 m² walkable area from the deck; the rest of this scenario (journeys,
signs, flow spawning) was written by hand
(Start from your own FDS case).
uv run python run.py --scenario assets/t_junction --print-summary --export-only Model: CollisionFreeSpeedModel
Seed: 42
Max time: 300s
Exits: 2
…
Sequence: jps-distributions_0 -> jps-checkpoints_0 -> exit_A_left -> exit_B_right
jps-distributions_0: 200 agents (flow: 0-400s)In plan view:
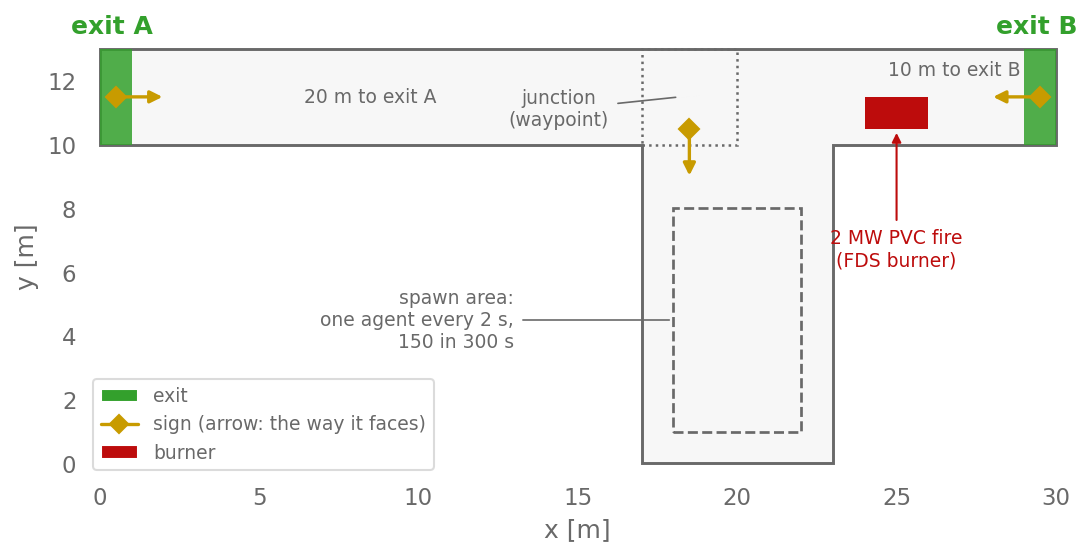
Agents enter the branch one every 2 s. The run stops at 300 s, so 150 of the 200 planned agents take part. Every agent walks to the junction, then to exit A, 20 m from the junction, or exit B, 10 m from it and past the fire.
The agents are discovery agents ("familiarity": "discovery" in
config.json). They start knowing only the spawn area. They learn the
junction and the exits when they can read their signs. Smoke can hide a sign.
The rules are on the wayfinding page.
3. The fire
The fire comes from FDS. pyFDS-Evac does not run FDS; it reads the slice files that FDS wrote.
Check the deck. Before you spend 20 minutes on FDS, check that the deck asks for the slices the run reads:
uv run pyfds-evac init assets/t_junction/t_junction.fds --checkFrom the unpacked zip, drop uv run. The check writes nothing, prints one
✓ line each for the extinction coefficient, CO, CO2, O2 and T_END, and
ends with:
✓ The deck has what a pyFDS-Evac run reads.Get the FDS output. The deck is assets/t_junction/t_junction.fds: a
2 MW PVC fire on a 2 m × 1 m burner, 300 s, four meshes. Either run it
yourself:
mkdir -p fire && cp assets/t_junction/t_junction.fds fire/
cd fire && mpiexec -n 4 fds t_junction.fds && cd ..
With FDS 6.10.1 and four MPI processes it took 1169 s, about 20 minutes, on
an Apple M3 Pro. The deck has four meshes, so it cannot use more than four
processes. fds t_junction.fds without mpiexec runs it on one process, more
slowly.
The rest of this page calls the output directory $FDS:
FDS=fireCheck what it contains.
uv run python run.py --scenario assets/t_junction --fds-dir "$FDS" --inspect-fds{
"data_3d": [],
"devices": [],
"slices": [
"CARBON DIOXIDE VOLUME FRACTION",
"CARBON MONOXIDE VOLUME FRACTION",
"HYDROGEN CHLORIDE VOLUME FRACTION",
"OXYGEN VOLUME FRACTION",
"SOOT EXTINCTION COEFFICIENT",
"SOOT VISIBILITY"
],
"smoke_3d": []
}The extinction coefficient slows the agents and hides signs. CO, CO2 and O2
give the toxic dose (FED). The deck has no TEMPERATURE slice, and heat FED
is off by default anyway.
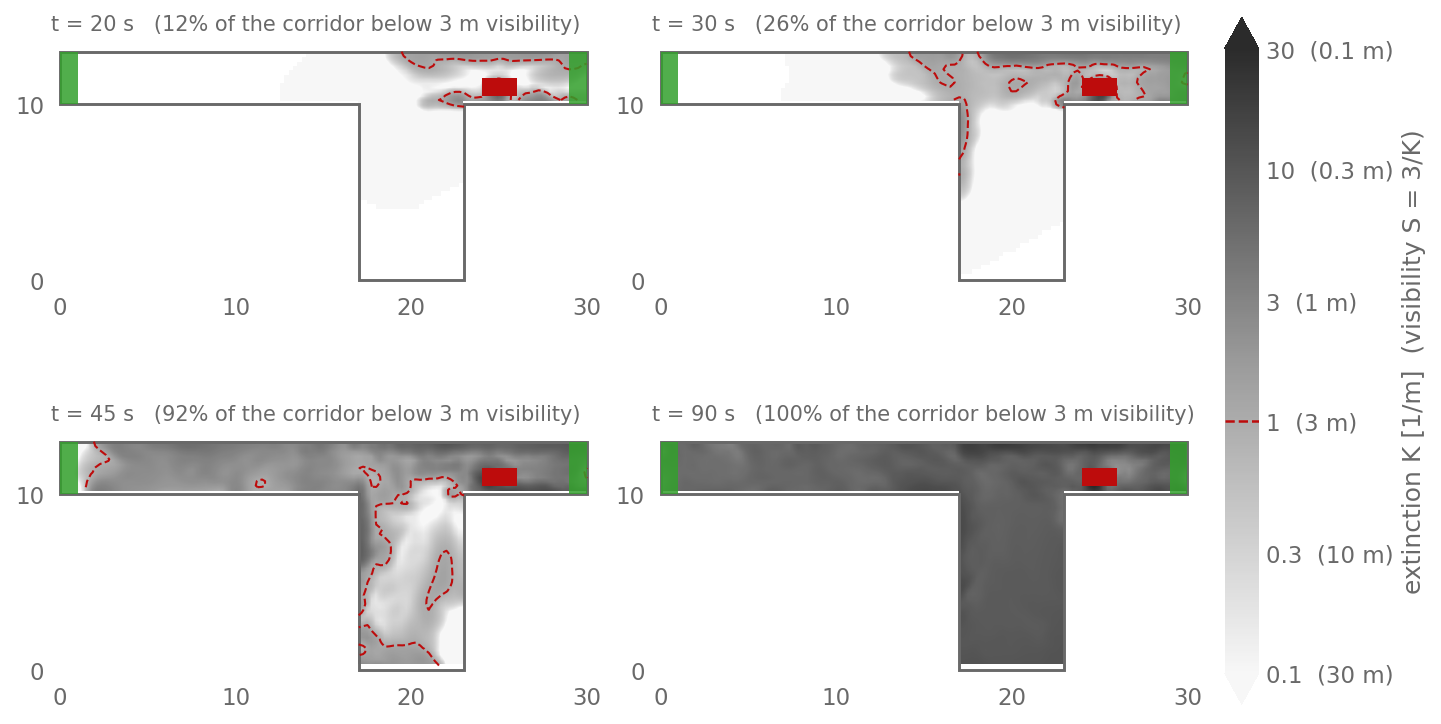
Smoke reaches the junction at about 30 s. By 90 s it fills the whole T, with a median extinction coefficient K of 8 1/m, a visibility of about 0.4 m.
The deck writes its slices at z = 2.0 m only. pyFDS-Evac samples at 1.6 m by default, the FDS+Evac head height, and takes the nearest slice, here 2.0 m.
4. Run it
mkdir -p tj
uv run python run.py --scenario assets/t_junction --fds-dir "$FDS" \
    --output-sqlite tj/tj_fire.sqlite \
    --output-smoke-history tj/tj_fire_smoke.csv \
    --output-fed-history tj/tj_fire_fed.csv \
    --output-route-history tj/tj_fire_routes.csv
It takes about 10 s. The output ends with:
Configuring smoke calculation.
Configuring FED calculation.
Heat FED is off; pass --enable-heat-fed to accumulate it.
Configuring rerouting.
Configuring visibility model (3 signs).
Configuring tenability (FIC slowdown=off, FIC alpha=0.7, min=0.3, FED median=1.0, incapacitation=deterministic, heat FED median=1.0, heat incapacitation=deterministic).
Initialization finished.
Simulation started.
…
Simulation incomplete: time limit reached after 300.00 s (99/150 evacuated, 51 remaining, 50 not spawned).
Route history rows: 163
Agents that left by an exit not in their map: 87
Route history rows counts the rows of tj_fire_routes.csv, not route
switches: one default_route row per agent at spawn (150), and 13 rows of
the 12 agents that choose an exit once they see a sign: one initial, ten
learned_exit and two smoke_reroute, agents that change exit for smoke
(Exit usage).
The run reaches the 300 s time limit with agents still inside or still to
enter, so it is incomplete and run.py exits with status 2
(Exit status).
Before this, fdsreader logs Module vents: could not convert string to float
for this deck, and the terminal also shows a numpy UserWarning
message. Neither affects the run. The progress
line counts the 200 planned agents, not the 150 that spawned
(#279).
These are the defaults, as in FDS+Evac:
every agent is incapacitated at FED = 1, heat FED is off, and irritants (the
HCl slice) slow nobody unless you pass --enable-fic-speed.
The run writes five files:
| File | What it holds |
|---|---|
tj_fire.sqlite | trajectories at 10 frames/s (JuPedSim format), with FED and speed per agent |
tj_fire.manifest.json | versions, seed, scenario, FDS directory and FDS version |
tj_fire_smoke.csv | per agent and second: position, extinction K, speed factor |
tj_fire_fed.csv | per agent and second: gas concentrations, FED, FIC, incapacitated |
tj_fire_routes.csv | every route change, with its time and reason, and the default_route row written at spawn for each agent that follows its default route |
For the clear-air comparison below, run the same command without --fds-dir:
uv run python run.py --scenario assets/t_junction \
    --output-sqlite tj/tj_clear.sqlite
The same run from Python. examples/first_fds_case.py takes the FDS
directory as its argument:
uv run python examples/first_fds_case.py "$FDS"build_run_kwargs is the function run.py calls, so the run is the same.
The script imports:
import sys
from collections import Counter
from types import SimpleNamespace

from pyfds_evac import build_run_kwargs, load_scenario, run_scenario

FDS_DIR = sys.argv[1] if len(sys.argv) > 1 else None
and runs:
scenario = load_scenario("assets/t_junction")
opts = SimpleNamespace(
    seed=None,  # the scenario's baseSeed, 42
    fds_dir=FDS_DIR,
    constant_extinction=None,
    smoke_update_interval=1.0,
    smoke_slice_height=1.6,
    disable_tenability=False,
    fed_threshold=1.0,
    fic_alpha=0.7,
    fic_min_factor=0.3,
    enable_rerouting=True,
    reroute_interval=1.0,
    vis_cache=None,
)
result = run_scenario(scenario, **build_run_kwargs(scenario, opts))

print(f"evacuated: {result.agents_evacuated}/{result.total_agents} in 300 s")
if FDS_DIR is not None:
    print(f"FED max:   {result.metrics['fed_max']:.2f}")
    reasons = Counter(r["reason"] for r in result.route_history)
    print(f"route history rows by reason: {dict(reasons)}")
evacuated: 99/150 in 300 s
FED max: 0.23
route history rows by reason: {'default_route': 150, 'initial': 1, 'smoke_reroute': 2, 'learned_exit': 10}5. Results
The figures below are drawn from these files by
scripts/docs/first_fds_case_figures.py:
uv run python scripts/docs/first_fds_case_figures.py --data "$FDS" --runs tjWhere the agents went
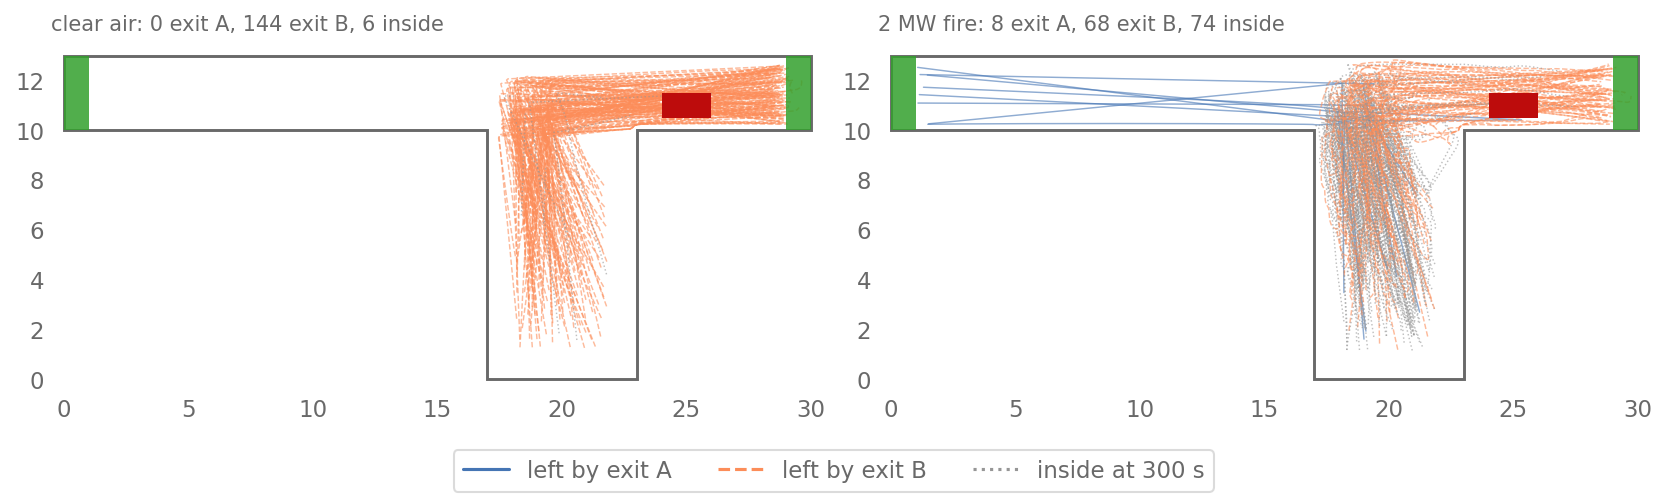
In clear air everyone takes the nearer exit B. In the fire, 12 early agents turn to exit A as smoke builds up on B’s side. 51 of the 150 agents are still inside at 300 s.
The run, animated
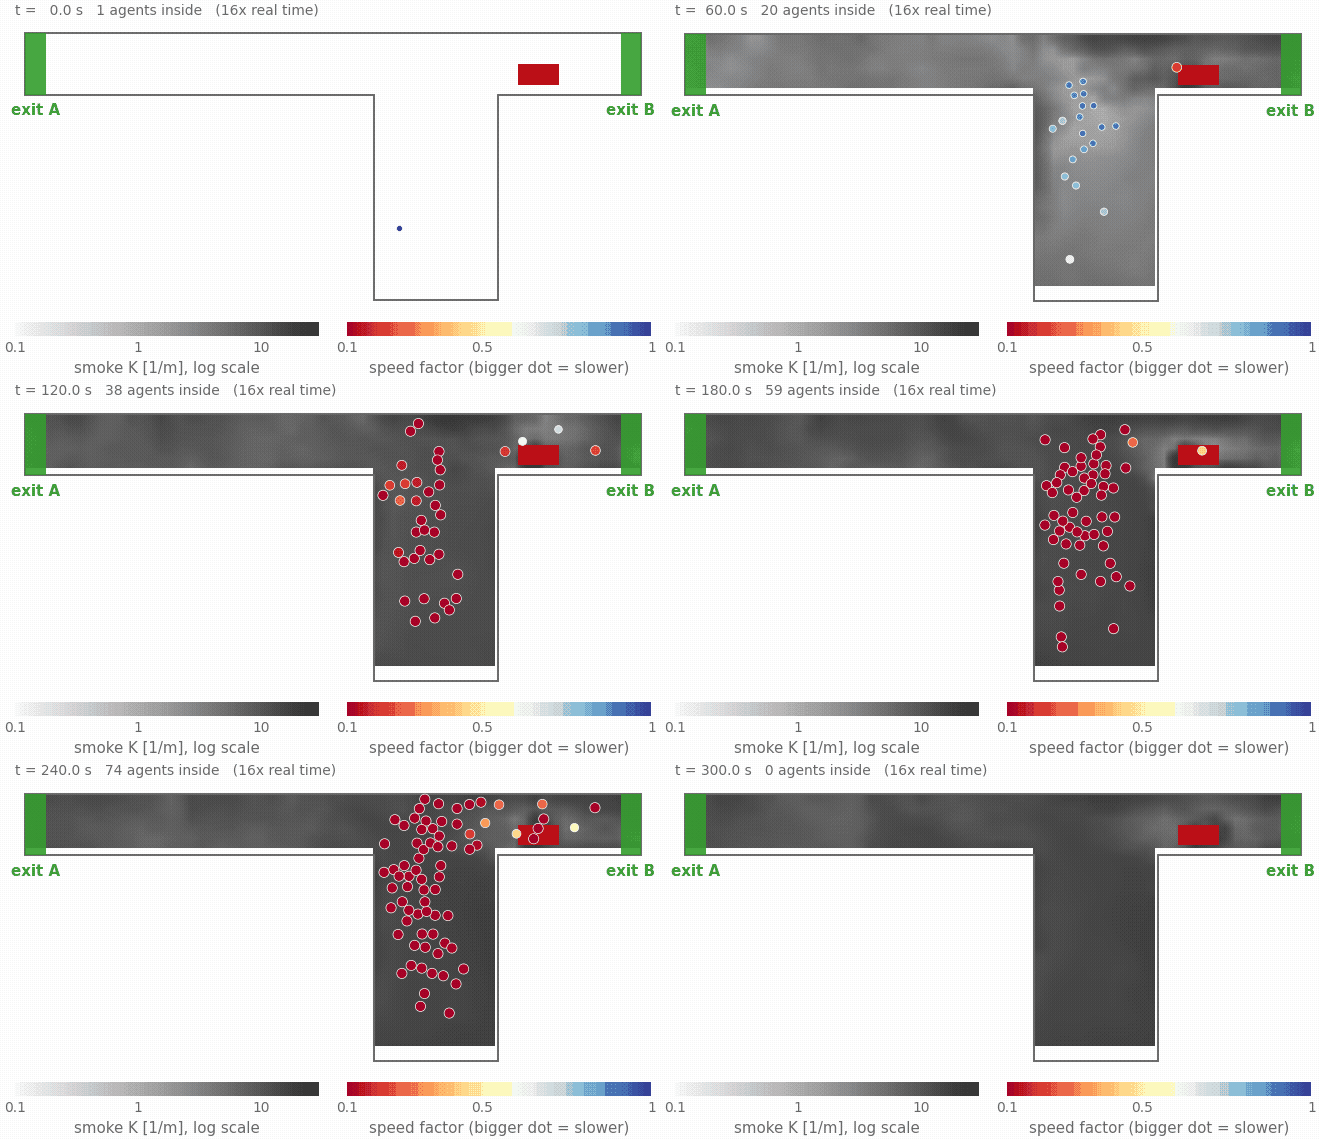
The background is the extinction field the agents read. Red, large dots are agents the smoke has slowed. From about 120 s almost every agent crawls.
Evacuated over time
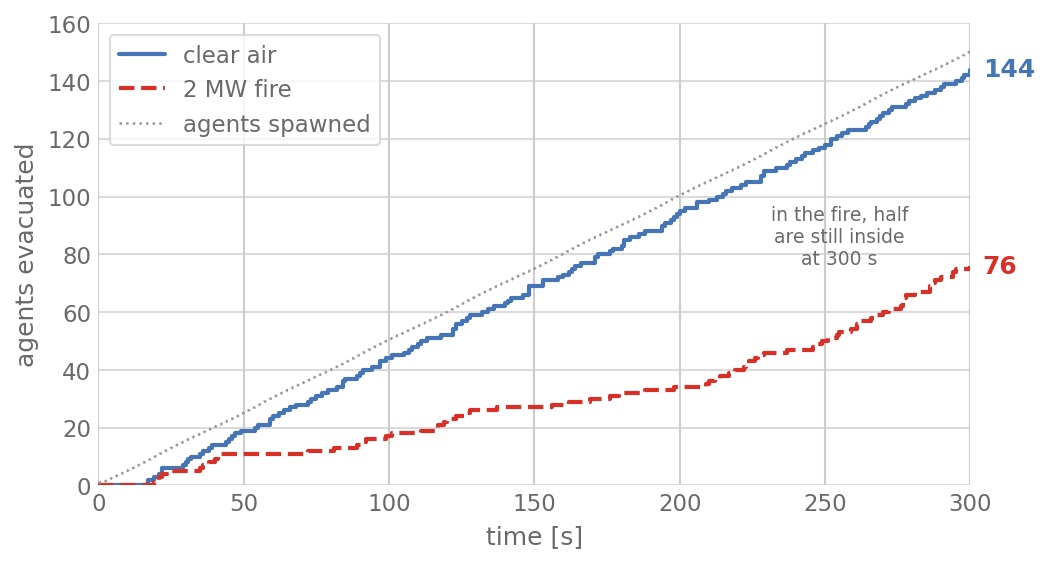
In clear air, agents leave about as fast as they arrive. In the fire, the gap opens at about 45 s, when the smoke has filled the junction.
Dose and speed
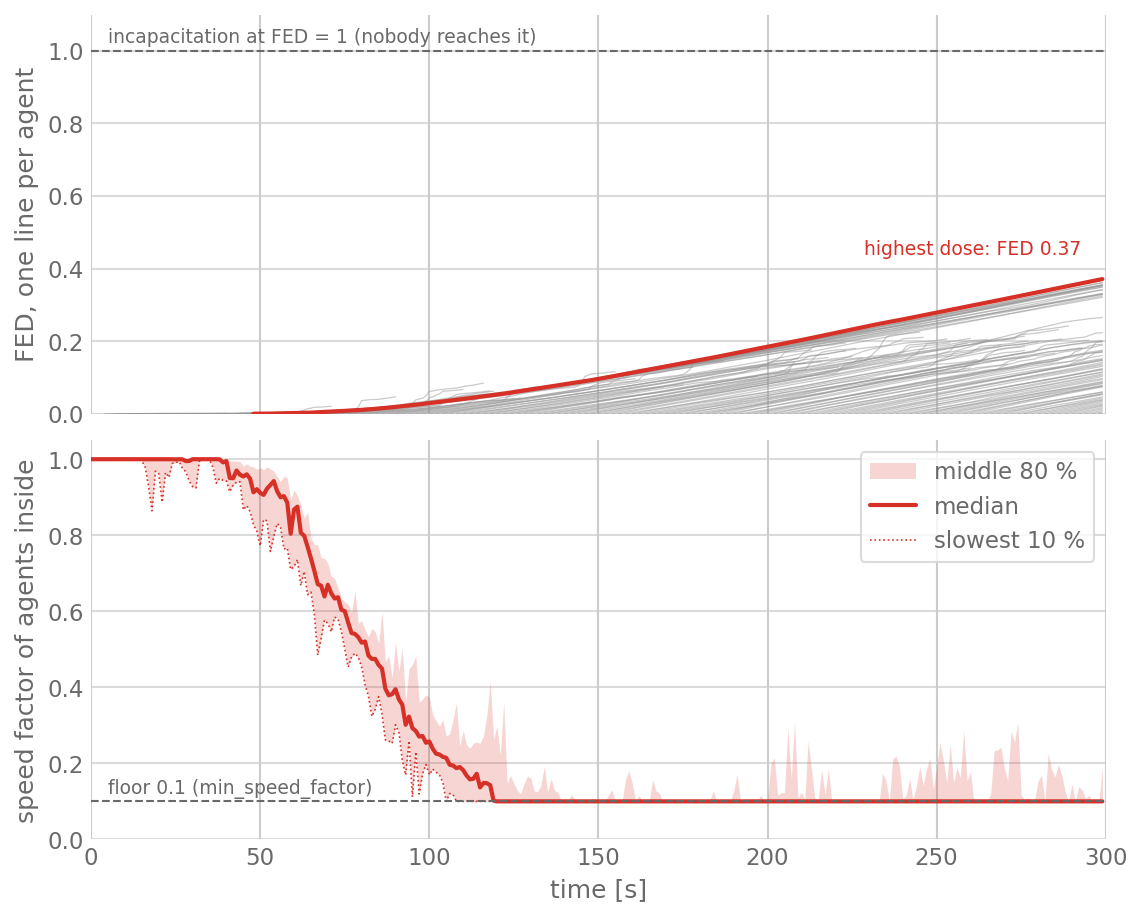
Nobody is incapacitated by the toxic dose: the highest FED is 0.23. This
does not mean that conditions were tenable; section 6
compares visibility and irritant limits with the exit times. In the run,
the smoke acts on the agents through their speed, their route choice and
the signs they can read; the engine records the irritant measure (FIC) but
does not act on it by default. The default speed law (lund) multiplies the walking
speed by
1 + beta * K / alpha, clamped to [0.1, 1]. At K = 3 1/m this is
1 + (-0.057 × 3.0) / 0.706 = 0.76. Above K = 11 1/m it is the floor, 0.1,
and from 120 s the median agent is there.
Exit usage
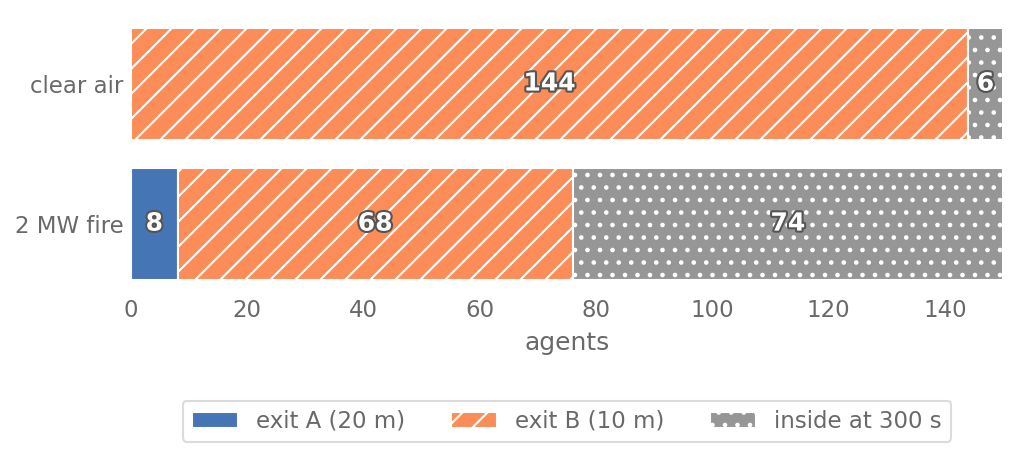
The route log and the exit history explain the fire run. Every agent starts
with no exit in its map, so each gets one default_route row at spawn: it
follows the scenario’s journey, which sends 99 % of the agents from the
junction to exit B. Only 12 agents ever learn an exit, all in the first
27 s. Agent 1 learns exit B at 5 s (initial) and switches to exit A at
6 s for smoke (smoke_reroute). Agents 2–12 read exit A’s sign and leave
their default route to exit B for it, so the row names exit B as the old
exit: ten as learned_exit, and agent 4, which also knows exit B, for smoke
(smoke_reroute). All 12 leave by exit A. The other 138 never learn an
exit. 87 of them leave by exit B without knowing it:
they follow the default route, not a choice of theirs, and the exit history
flags their exit as not in their map (exit_in_map false); the run log
counts them. The remaining 51, slowed by the smoke, are still inside at 300 s.
This is the FDS+Evac default for an agent that knows no door; to make such
agents explore or stand instead, set no_known_exit
(Models › Wayfinding §2.4).
6. Was there time to get out? (ASET and RSET)
Fire-safety engineering compares two times. The available safe escape time (ASET) runs until conditions become untenable. The required safe escape time (RSET) runs until people reach safety. The ASET and RSET page gives the definitions. This section applies them to the run above, one agent at a time. For each agent it asks when the air at the agent’s own position first crossed a tenability limit, and whether the agent got out before that.
The answer in short
- There is no single RSET and no single margin. Agents keep arriving until the run is cut off at 300 s, with 51 of them still inside.
- Visibility and HCl became untenable early. Each of six points in the T crossed the visibility limit between 18 and 46 s after ignition. The first agent met it at 29 s. Of the 98 agents who got out, 88 met it before they reached an exit.
- The irritant limits were passed by most of those who got out. 86 of the 98 met HCl ≥ 1000 ppm (ISO fractional effective concentration, FEC, of 1, the concentration at which half of a population is expected to be incapacitated) before their exit. The engine records the irritant measure (FIC) and does not act on it, so these agents kept walking.
- The toxic dose stayed low. No agent reached FED 0.3; the highest was 0.23. A person standing at the junction, the spawn centre or the branch mouth from ignition would reach it only at 270–275 s.
“Nobody reached FED 1” therefore does not mean “everyone had time”. This is one fire, one seed, and research software. The result describes this run only.
Make the numbers yourself
pyFDS-Evac does not compute ASET itself. A built-in report is planned in
#210. The
script
scripts/docs/first_fds_case_aset.py
reads the run files from step 4 and the FDS slices:
uv run python scripts/docs/first_fds_case_aset.py --data "$FDS" --runs tjFrom the unpacked zip, follow step 7 of its README.txt instead.
It takes under a minute (about 8 s with the run files in place) and prints every number in this section. The report starts with:
agents 150, spawned last at 298 s
trajectory: 99 left before 300 s, last exit 299.7 s
counted out (exit < 299 s) 98, censored 52
travel time median 74.2 s, max 129.8 sWho counts as out. The run reports 99 evacuated, and so does the trajectory: the last agent leaves at 299.7 s. The per-agent histories stop at 299 s, so an agent leaving in the last second could not be checked against the limits. The script therefore counts an agent as out only if it left before 299 s. One agent leaves in that last second: 98 got out and 52 are censored. For a censored agent we know only that its margin is negative or longer than the run.
Each agent against its own limits
Each row is one criterion, over all 150 agents. A limit counts as reached if the agent met it before it left, or before 299 s if it is still inside.
| Criterion (source) | Agents reaching it | First at | Got out, never reached it | Reached it, then got out | Reached it, still inside |
|---|---|---|---|---|---|
| Visibility 10 m (EA) with C = 3 (Jin; FDS default): K ≥ 0.3 1/m | 140 | 29 s | 10 | 88 | 52 |
| HCl ≥ 200 ppm (Purser escape impairment, FICimp = 1) | 139 | 30 s | 11 | 87 | 52 |
| HCl ≥ 300 ppm (ISO FEC 0.3) | 138 | 35 s | 12 | 86 | 52 |
| HCl ≥ 900 ppm (SFPE FIC = 1) | 138 | 36 s | 12 | 86 | 52 |
| HCl ≥ 1000 ppm (ISO FEC 1) | 138 | 36 s | 12 | 86 | 52 |
| CO ≥ 2,700 ppm (EA) | 76 | 40 s | 29 | 69 | 7 |
| FED ≥ 0.3 (FDS+Evac form) | 0 | – | 98 | 0 | 0 |
| FED ≥ 1 (FDS+Evac form) | 0 | – | 98 | 0 | 0 |
The 88 agents who got out after the visibility limit spent a median of 81 s, and at most 130 s, inside beyond it. The four HCl limits change the count of evacuees who met a limit only from 88 to 86–87. CO above 2,700 ppm is met next to the burner, by agents who pass it on their way to exit B.
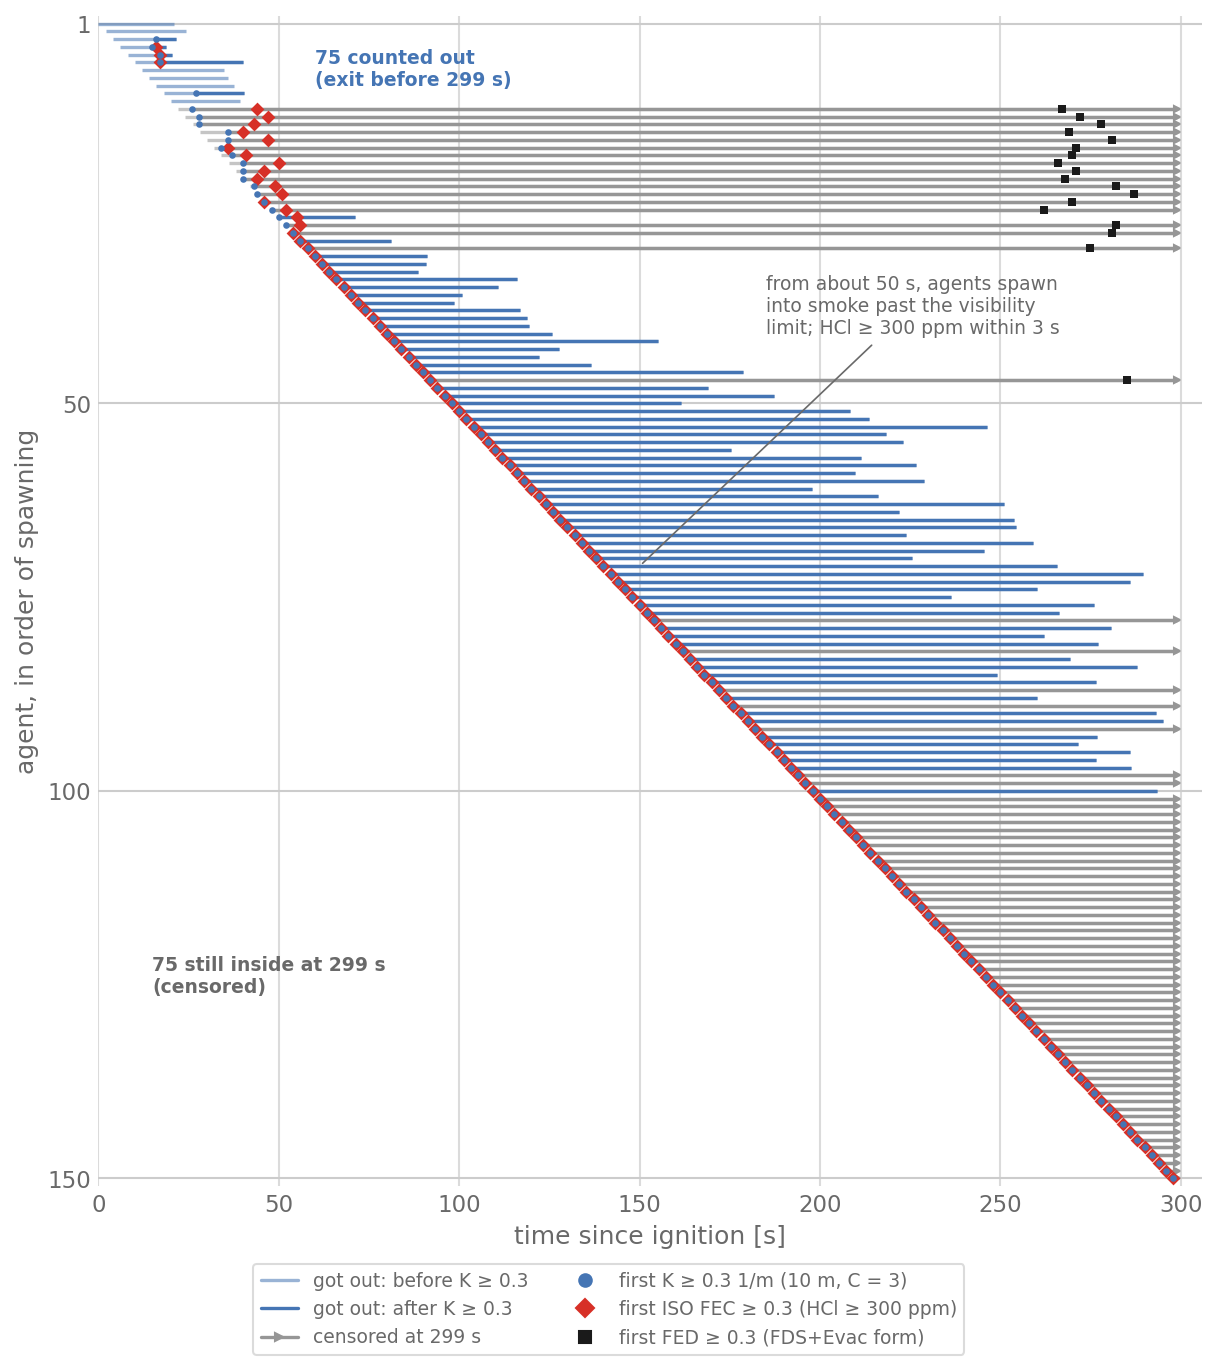
One bar per agent (n = 150, seed 42), from spawn to exit, or to 299 s for the 52 censored agents (grey, arrow). The solid part is the time spent beyond K ≥ 0.3 1/m. Markers: first K ≥ 0.3 1/m (circle), first HCl ≥ 300 ppm (diamond), first FED ≥ 0.3 (square); the other criteria of the table are left out to keep the bars readable. Censoring is shown by the grey colour and the arrow. Values at the agent’s position, z = 2.0 m, 1 s resolution..
Read the figure from the left edge of each bar. The first 10 agents got out before the visibility limit reached them; the next dozen met it on the way. From about 50 s on, every agent spawns into air that is already past the visibility limit, and meets HCl ≥ 300 ppm within about 3 s of spawning. After 46 s, when the last of the six points below crosses the visibility limit, 127 of the 150 agents are still to spawn.
At fixed points: location ASET
The classic ASET is read at a place, not at a person: the first time a limit is met at a fixed point, counted from ignition. It needs no agents, and it says nothing about who was there.
| Location (x, y) [m] | K ≥ 0.3 1/m | HCl ≥ 300 ppm (ISO FEC 0.3) | HCl ≥ 1000 ppm (ISO FEC 1) | FED ≥ 0.3, standing there from t = 0 |
|---|---|---|---|---|
| Exit B (29, 11.5) | 18 s | 28 s | 40 s | not by 300 s |
| Junction (18.5, 11.5) | 24 s | 45 s | 59 s | 274 s |
| Left corridor (10, 11.5) | 36 s | 38 s | 58 s | not by 300 s |
| Spawn centre (20, 4.5) | 41 s | 54 s | 64 s | 270 s |
| Exit A (1, 11.5) | 45 s | 47 s | 50 s | not by 300 s |
| Branch mouth (20, 9) | 46 s | 51 s | 68 s | 275 s |
CO does not reach 2,700 ppm at any of these points within 300 s.
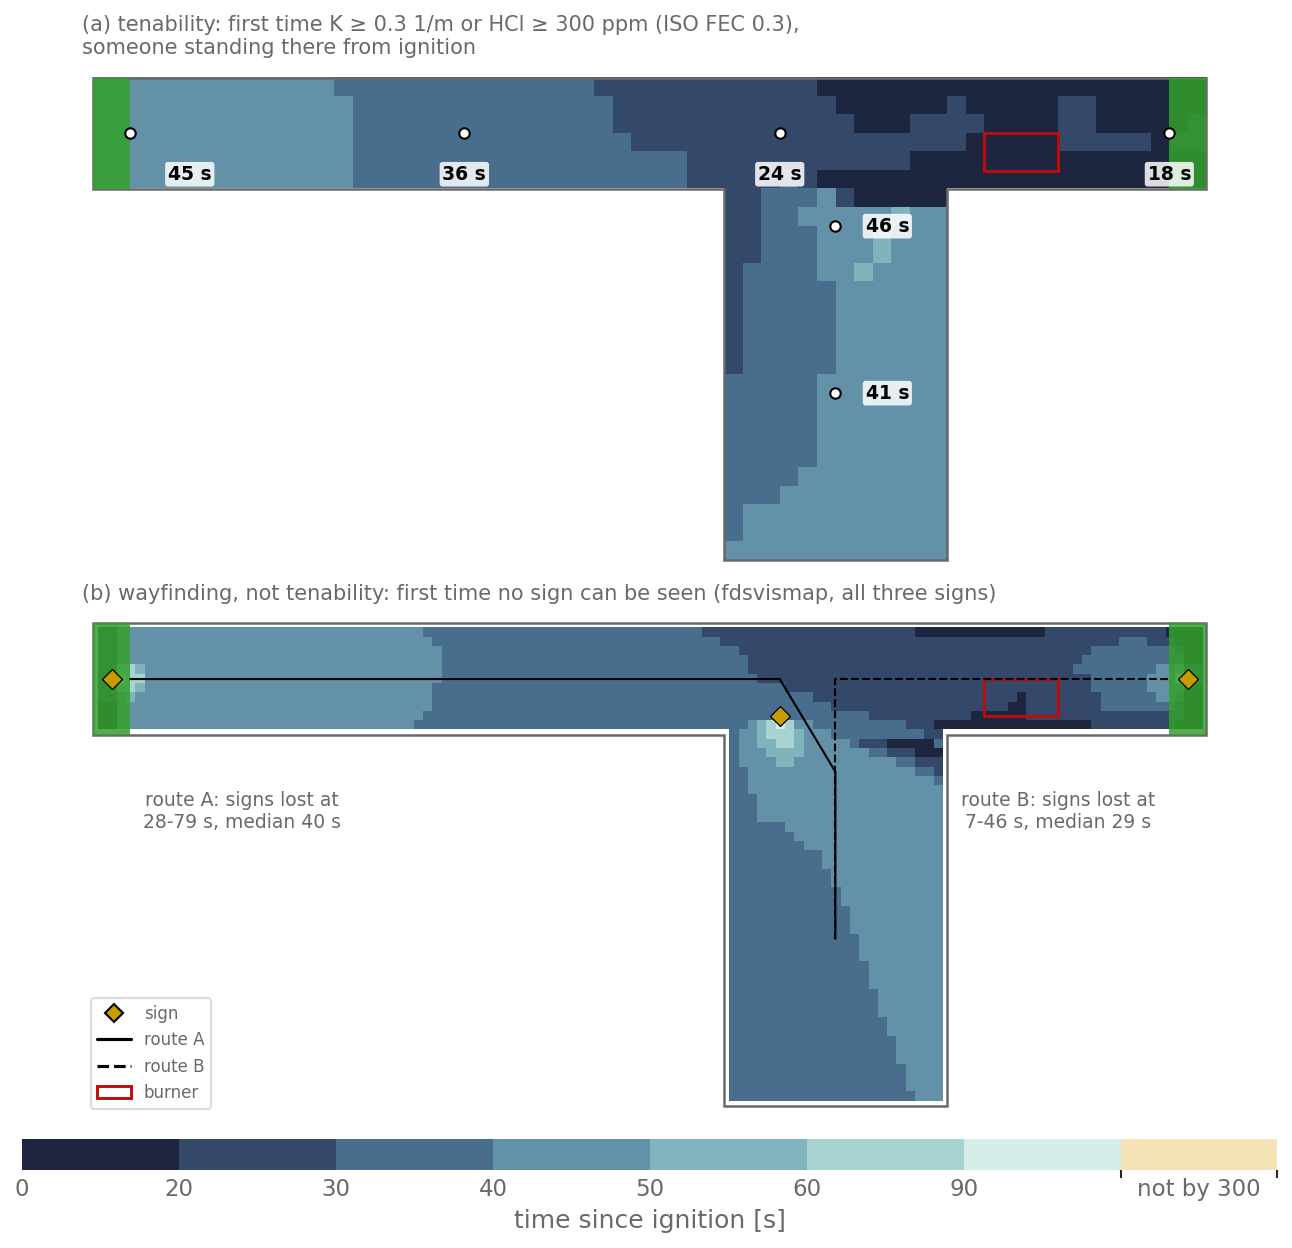
(a) Location ASET at z = 2.0 m on a 0.5 m grid: the earlier of K ≥ 0.3 1/m
and HCl ≥ 300 ppm, for a person standing still from ignition. Labels: that
time at the six points of the table. (b)
The first time no sign can be seen from a cell (fdsvismap get_aset_map,
0.25 m grid, all three signs, c = 3, visibility capped at 30 m). A cell
counts at its first loss of sight, even if a sign becomes visible again
later, and a cell that never loses sight cannot be told apart from one
that loses it at 300 s. Heat is
not included in either panel. The map form follows Schröder et al. (2020);
ASET-RSET maps after Schröder et al. (2020) re-runs
their demonstration case.
Panel (b) measures wayfinding: it shows when the signs stop guiding. This is consistent with section 5, where 138 of the 150 agents never learned an exit: on this map the spawn centre loses sight of every sign at 39 s. The engine’s own sign test differs (see How the numbers are computed). ISO 13571 (§4.5, note) does not expect obscuration alone to make conditions untenable for people who are not carrying out cognitive or motor tasks: it treats obscuration as mattering through the tasks it impairs, such as finding an exit. This page assesses it through wayfinding. The slider shows sign visibility through time, one map per route.
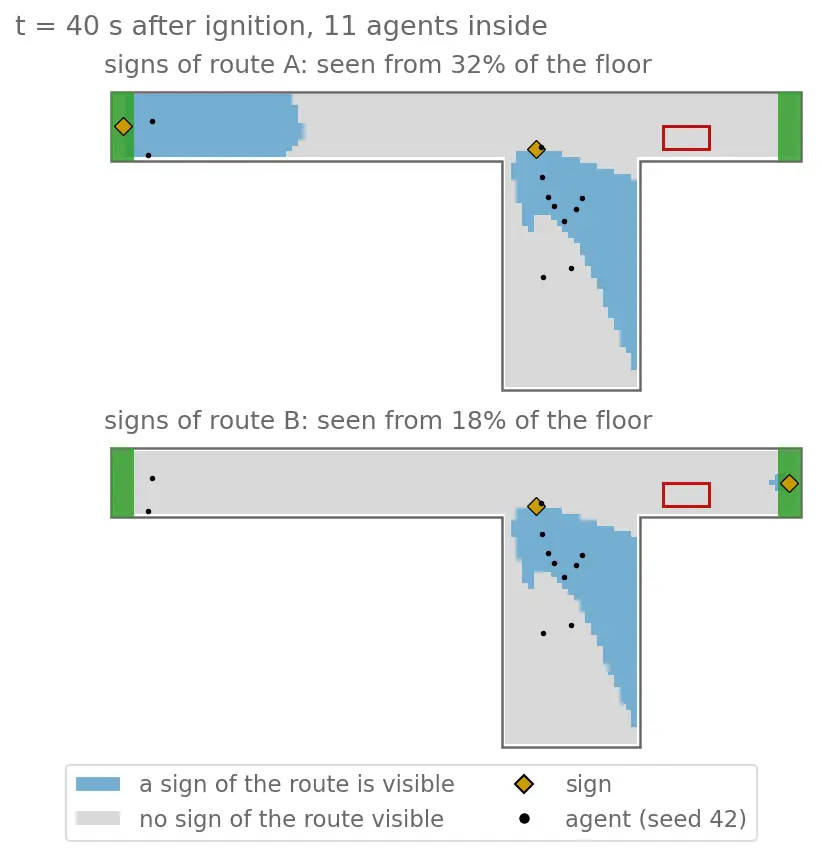
get_agg_vismap(t, route)). A sign counts as seen when the visibility along
the line of sight, c divided by the mean K along it, with c = 3 and
capped at 30 m, reaches the
distance to the sign. Frames every 10 s; the fdsvismap times are 1 s apart.
This is sign visibility, a wayfinding measure, not tenability (ISO
13571:2012, §4.6 f, p. 3). A cell with a visible sign may already be untenable
because of HCl or CO. A cell without one is not thereby untenable. Heat is
not evaluated in this run. Cells that never see a sign, because of
distance, walls or viewing angle, show geometry, not smoke. Dots are agent
positions from one run (seed 42) and say nothing about whether those agents
are safe.Why there is no single RSET here
ISO/TR 16738 builds RSET from detection, alarm, pre-movement and travel times, counted from ignition (see ASET and RSET). This run fits none of it:
- The inflow never stops. One agent spawns every 2 s until the run ends. Each agent’s exposure starts when it spawns, while all times on this page count from ignition.
- The run is cut off. It stops at 300 s with most late spawners inside. The time limit sets the last exit, 299.7 s, so it gives no RSET.
- There is no detection, alarm or pre-movement
(
"use_premovement": false). Exit minus spawn is travel time only: a median of 74.2 s and a maximum of 129.8 s for the 98 who got out.
More seeds would not supply an RSET either, because every seed stops at the same 300 s. For a scenario in which everyone gets out, see the ensemble how-to. For one where everyone is placed at t = 0 and gets out, with RSET mapped cell by cell, see ASET-RSET maps after Schröder et al. (2020).
What this does not show
The exit times rest on walking speeds far outside the data. The default speed law comes from Frantzich and Nilsson’s experiments, which covered K = 1.9–7.4 1/m. Purser’s fit to Jin’s data covers K ≈ 0.30–1.27 1/m (see walking speed in smoke). In this run the median K at the agents is 13.4 1/m, a visibility of about 0.2 m with C = 3. 89 % of the agent-seconds lie above 7.4 1/m, and 74 % sit at the speed floor of 0.1, which the law reaches at K = 11.15 1/m. The exit times, and the number still inside, are set by that floor, not by measured behaviour. Sign legibility and route choice are extrapolated in the same way: Jin’s visibility data end near K ≈ 1.8 1/m (see Visibility).
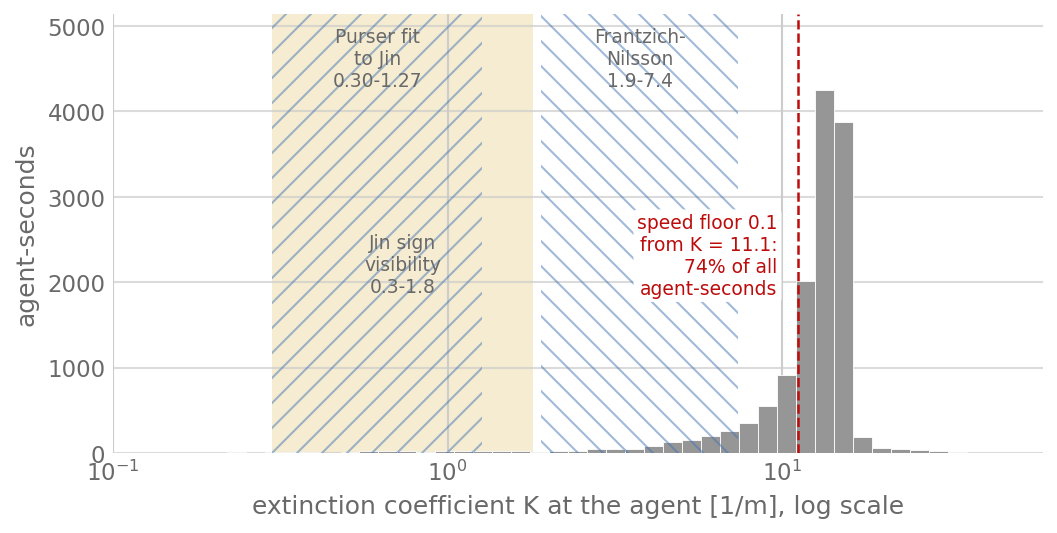
Extinction coefficient K [1/m] at the agents, one count per agent and second
inside (n = 9,352; the 296 with K < 0.1 1/m are not shown). Hatched: the K
ranges of the data behind the speed laws, from
walking speed in smoke. Shaded: Jin’s
sign-visibility data for lit signs, K ≈ 0.3–1.8 1/m, from
Visibility. Dashed: the default lund law
reaches its floor of 0.1. The figure counts every agent-second, not only
the K at each agent’s first crossing, because the speed law and the sign
test act at every second.
The other limits:
- Per agent goes beyond the standard. ISO 13571 is meant for estimates over a population, not for specific individuals (§5.2, p. 4). The per-agent comparison is our use of it. The SFPE Handbook frames the same question, the time between losing visibility and incapacitation (Purser and McAllister 2026, p. 2341).
- The FED is the FDS+Evac sum (CO + CN + NOx + FLDirr) × HVCO2 + O2, which includes Purser’s lethal-dose term for HCl (see FED model). ISO 13571 keeps irritants out of the asphyxiant FED (§4.2.1). Applying the ISO thresholds to it is an analogy. FED 0.3 is a threshold for susceptible people, not a “safe” value: ISO treats 1 as the median of a log-normal response, so at 0.3 11.4 % of a population is still expected to be affected (A.5.2, p. 18; see Incapacitation thresholds).
- The irritant criteria are analogies too. ISO 13571 ties one threshold to its own FED and FEC (§5.4; A.5.2, p. 18). Here that threshold is applied to an FDS+Evac FED and to HCl. The table gives each source’s own value, and the conclusion is the same for all four.
- HCl is probably overestimated. The deck has no loss of HCl to walls, so all the HCl produced stays in the gas. The irritant crossings are likely early.
- Visibility. The EA note gives 10 m, not a K. C = 3 (Jin’s value for a reflecting sign, and the FDS default) turns it into 0.3 1/m. The result barely depends on this: any K from 0.23 to 0.8 1/m changes the first crossing of at most 8 agents, by at most 6 s. The EA limits apply to exposures under 10 minutes. The 10 m criterion is from EA, not from ISO: ISO 13571 clause 9 (pp. 11–12) treats obscuration through a fuel mass-loss concentration, not a visibility distance.
- One height. Every value is at z = 2.0 m, the only slice height in the deck. The EA note evaluates its limits at 2.0 m too.
- Heat is not evaluated. The deck has no temperature slice, so the FED
CSV reports a constant 20 °C. The only temperature is the
T_firedevice above the burner, which is not a value on the route. - The engine does not act on these limits. It records FIC; the script
finds the visibility crossings afterwards. The speed reduction in smoke is
a separate model, and
--enable-fic-speedturns on an irritant slowdown, not incapacitation by FIC. - Time resolution. Crossings come from the 1 Hz histories, to about 1 s. Exit times come from the trajectory, to 0.1 s.
- ASET/RSET is itself contested. Babrauskas, Fleming and Russell (2010) argue that RSET assumes people “act like robots” (p. 347), that it reduces a distribution to one number and a quantitative question to pass/fail (p. 348), and that both times change with the scenario (p. 353). Following Fleming (2000), whom they cite, they propose comparing designs by the margin ASET − RSET instead (pp. 350–351). Their evidence is residential fires and smoke alarms. The per-agent margins here answer part of the second point; the agents still do not investigate, rescue others or go back in.
How the numbers are computed
Spawn and exit. From the trajectory tj_fire.sqlite at 10 frames per
second: an agent’s spawn time is its first frame, its exit its last frame.
An agent counts as out if it left before 299 s (see “Who counts as out”).
Per agent. For each criterion, the first second in the smoke and FED histories at which the value at the agent’s position meets the limit, up to its exit:
- K is
extinction_per_mfromtj_fire_smoke.csv. - FED is
fed_cumulativefromtj_fire_fed.csv, and CO isco_percent× 10⁴. - HCl has no column. The engine’s
ficis HCl / 900 ppm (the SFPE incapacitation concentration), because HCl is the only irritant in this deck. So HCl = 900 ×fic, ISO FEC = 0.9 ×ficand FICimp = 4.5 ×fic. The script checks this on every row: HCN, NO and NO₂ are zero, and 900 ×ficequals 114,000 ×fld_rate_per_min(Purser’s lethal dose for HCl), which rules out HF, SO₂, acrolein and formaldehyde. HBr has the same two denominators, so the check cannot exclude it; the deck’s species list (N₂, O₂, H₂O, CO₂, CO, soot, HCl, vinyl chloride) rules it out.
At fixed points and on the grid. The script samples once per second
from 0 to 300 s with ExtinctionField.from_fds and FdsFedField.from_fds,
the readers the engine uses. It first asserts that the extinction, HCl and CO
slices are at z = 2.0 m. The FED column adds DefaultFedModel.sample_rate
× 1 s / 60 from t = 0.
Sign visibility. fdsvismap 0.3.2, with the three signs of
config.json (c = 3, their positions and directions), visibility between
0 and 30 m, and one time point per second. Route A is spawn → junction →
exit A with the junction and exit A signs; route B likewise. The engine
uses the same fdsvismap with its own per-sign distance caps, so its sign
decisions can differ slightly from these maps.
The limits and their sources.
- Visibility. Engineers Australia (2014, §5.2 and Fig. 8, p. 15): 10 m for exposures under 10 minutes, evaluated at 2.0 m, untenable when any one criterion is exceeded. See Visibility for K = C/V.
- HCl. SFPE Ch. 70, Table 70.4 (p. 2288): 200 ppm for escape impairment, 900 ppm for incapacitation, and 1000 ppm as the ISO 13571 value (ISO 13571 §6.2.1, Eq. 4, p. 7, with an uncertainty of ±50 %). ISO 13571 uses the same threshold for FED and FEC (§5.4; A.5.2, p. 18), so 0.3 gives 300 ppm. See Irritants.
- CO. 2,700 ppm, from the same EA figure.
- FED. 0.3 and 1, the ISO 13571 thresholds (§5.4), applied to the FDS+Evac FED.
Sources
- Babrauskas, V., Fleming, J. M., & Russell, B. D. (2010). RSET/ASET, a flawed concept for fire safety assessment. Fire and Materials, 34(7), 341–355. doi:10.1002/fam.1025
- Börger, K., Belt, A., & Arnold, L. (2024). A waypoint based approach to visibility in performance based fire safety design. Fire Safety Journal, 150, 104269. doi:10.1016/j.firesaf.2024.104269
- Engineers Australia Society of Fire Safety (2014). Practice note for tenability criteria in building fires, version 2.0, §5.2 and Fig. 8, p. 15. Full reference on ASET and RSET.
- fdsvismap, release 0.3.2 (PyPI).
- ISO 13571:2012, §4.2.1, §4.5 (note), §4.6 f (p. 3), §5.2 (p. 4), §5.4, §6.2.1 (p. 7), clause 9 (pp. 11–12) and A.5.2 (p. 18), and ISO/TR 16738:2009: paraphrased; see ASET and RSET, Irritants and Incapacitation thresholds.
- Purser, D. A., & McAllister, J. L. (2026). Assessment of hazards to occupants from smoke, toxic gases, and heat. SFPE Handbook of Fire Protection Engineering, 6th ed., Ch. 70. Table 70.4 (p. 2288) and p. 2341. doi:10.1007/978-3-031-59212-6_70
- Schröder, B., Arnold, L., & Seyfried, A. (2020). A map representation of the ASET-RSET concept. Fire Safety Journal, 115, 103154. doi:10.1016/j.firesaf.2020.103154
What next
- Start from your own FDS case: check a deck and
turn it into a scenario with
pyfds-evac init. - What your FDS case must provide, before you use your own FDS output.
- Real-FDS walkthrough: FED from FDS slices, and how to spot a run that finishes but has no FED in it.
- How do I get RSET with its spread from an ensemble of seeds?
- Evacuation with and without the fire: the same fire, run uncoupled and coupled.
- Models: smoke and speed, FED, wayfinding, routing.
- Verification: ISO 20414, the tests the models are checked against.
- Fundamentals, the published laws behind the models: walking speed in smoke, asphyxiant FED, visibility.
pyFDS-Evac is research software, provided without warranty.