Can a model move like museum visitors and still take the wrong paths?
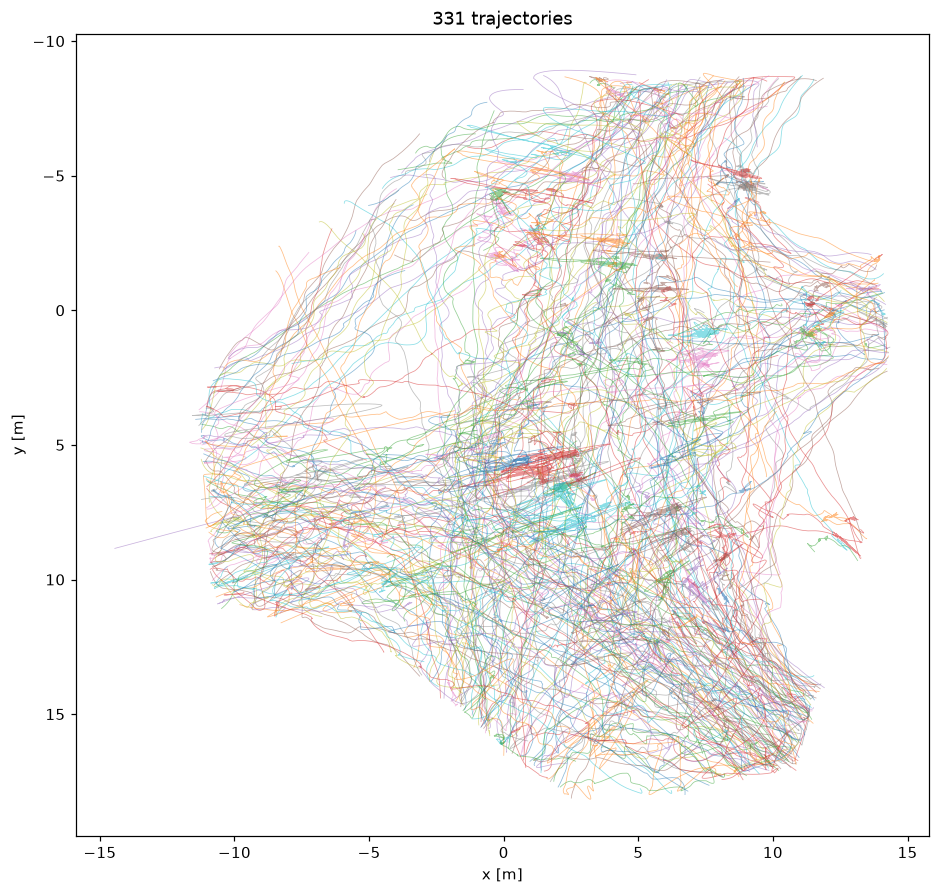
All 331 trajectories of the 6.5 minutes in one image. The apparent chaos is the overlay; the single paths are mostly straight.
We spent 6.5 minutes filming the atrium of the Guggenheim Bilbao from an upper balcony. We wanted to see how far a single phone video can be taken as a data source for crowd science, using open tools only.
From a phone video to trajectories
Detection and tracking use YOLO and ByteTrack. The handheld camera shakes, so we registered every frame to a reference frame before tracking. For calibration we used what the scene offers. The stone tile grid on the floor gives the geometry of the ground plane up to one unknown scale factor. That factor comes from the pedestrians themselves: the walking speed distribution has a clear peak, which we pin to the well-established free walking speed of 1.3 m/s. The tile size then comes out at about 0.73 m.
This makes the absolute scale an assumption, while angles and proportions are measured independently from the tiles. The tracking is monocular, from bounding-box feet, so occlusions add noise at short time lags. And it is one afternoon, 6.5 minutes. Nothing below claims more than that window.
We do not show the video itself, since it shows museum visitors. Everything below works from the extracted trajectories. The museum was not involved in this study.
The movement is not random
It looks random from above, but the mean squared displacement grows almost ballistically, with a slope of about 1.8 where a random walk would give 1. And 82% of one-second steps turn by less than 30 degrees. People walk in straight, purposeful legs.
The disorder comes from composition: many directed paths with different goals, crossing each other, plus about a third of all person-time spent standing (below 0.3 m/s). Stops are short and heavy-tailed, with a median of 2.4 s.
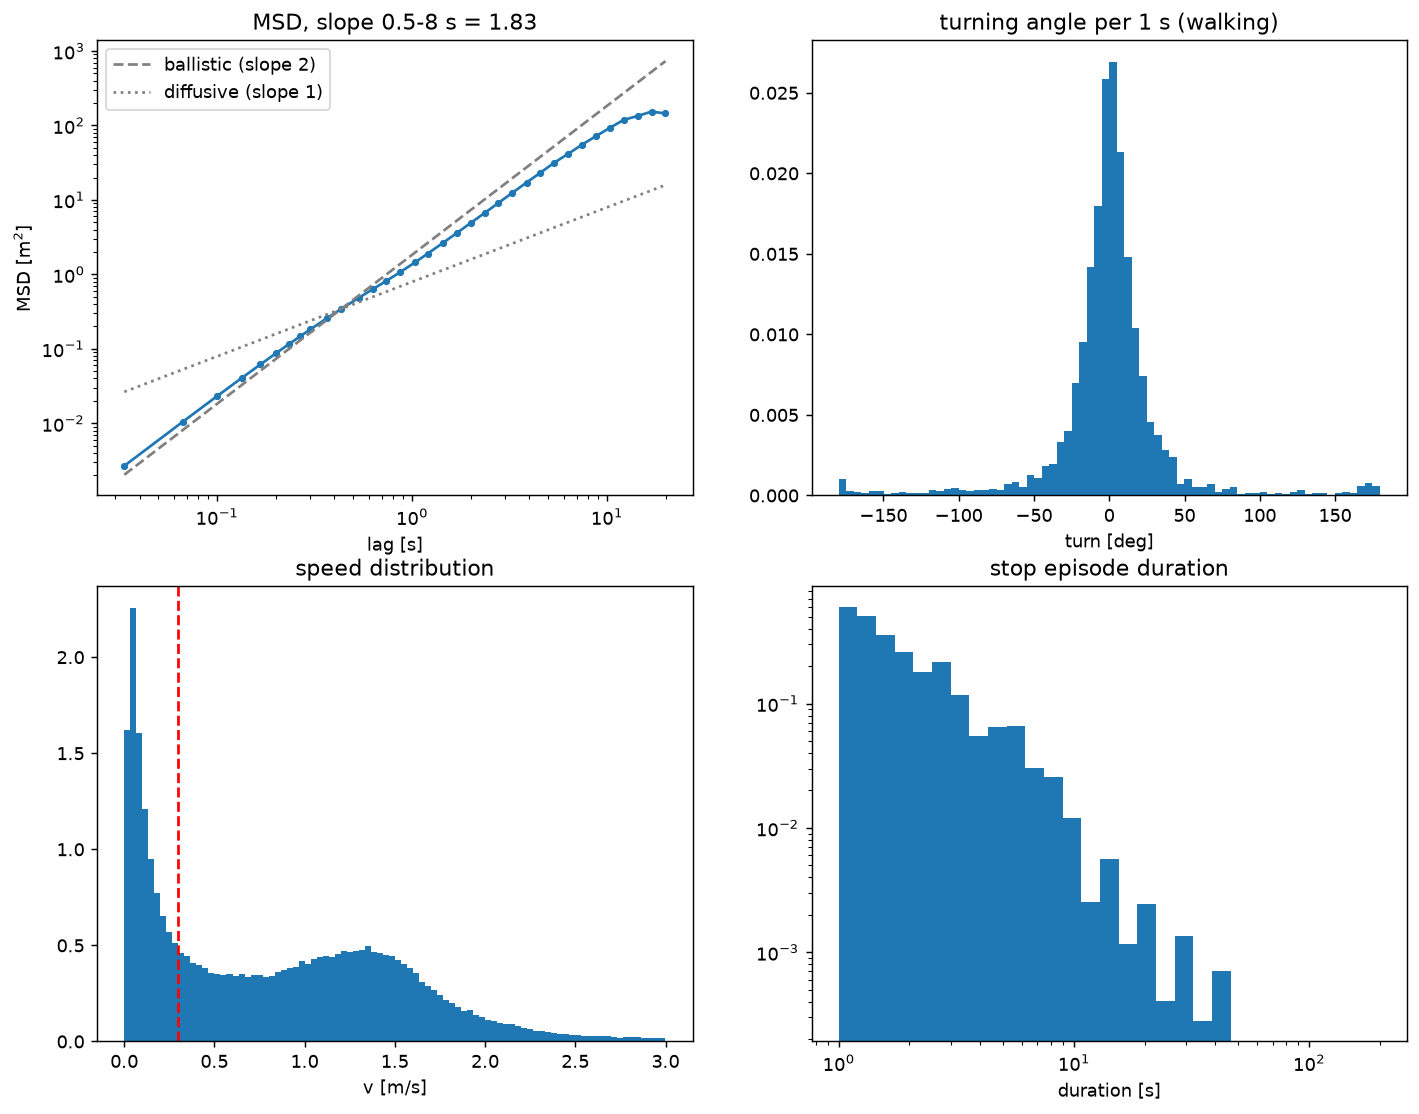
The tests behind the claim: mean squared displacement, turning angles, speed distribution, stop durations.
We also tested this at the level of whole routes, following the Louvre study by Yoshimura et al. Each track becomes a sequence of gates and stop points, compared against a random walk on the same graph. Both kinds of visitors are clearly non-random, but in opposite ways. Visitors who cross without stopping reuse a handful of corridors; the atrium works as a thoroughfare. Visitors who stop are the opposite: 43 different route types among 63 tracks, most of them unique. Yoshimura et al. found the same contrast between short-stay and long-stay visitors across the whole Louvre. It seems to be visible already within a single hall.
Where people stop, two classical indicators from visitor studies, attraction power (how many stop) and holding power (how long they stay), turn out to be negatively correlated here. The spot that attracts the most visitors holds them for about six seconds; the spot that holds visitors the longest attracts few. Stop durations follow a lognormal distribution, not the Weibull reported by Centorrino et al. for room visits in the Galleria Borghese. A pause in a hall is apparently a different thing than a visit to a room.
Rebuilding the atrium in JuPedSim
Then we built the same situation in JuPedSim. Agents enter at the measured times and gates. Destinations, stops and waiting times are drawn from the measured distributions. The model never sees an actual measured path.
The simulation reproduces the dynamics: the same near-ballistic displacement, the same speed distribution, stops in the right places. It also reproduces the flow structure. The interior of the atrium is a mixing zone with no lanes, and the simulation shows the same.
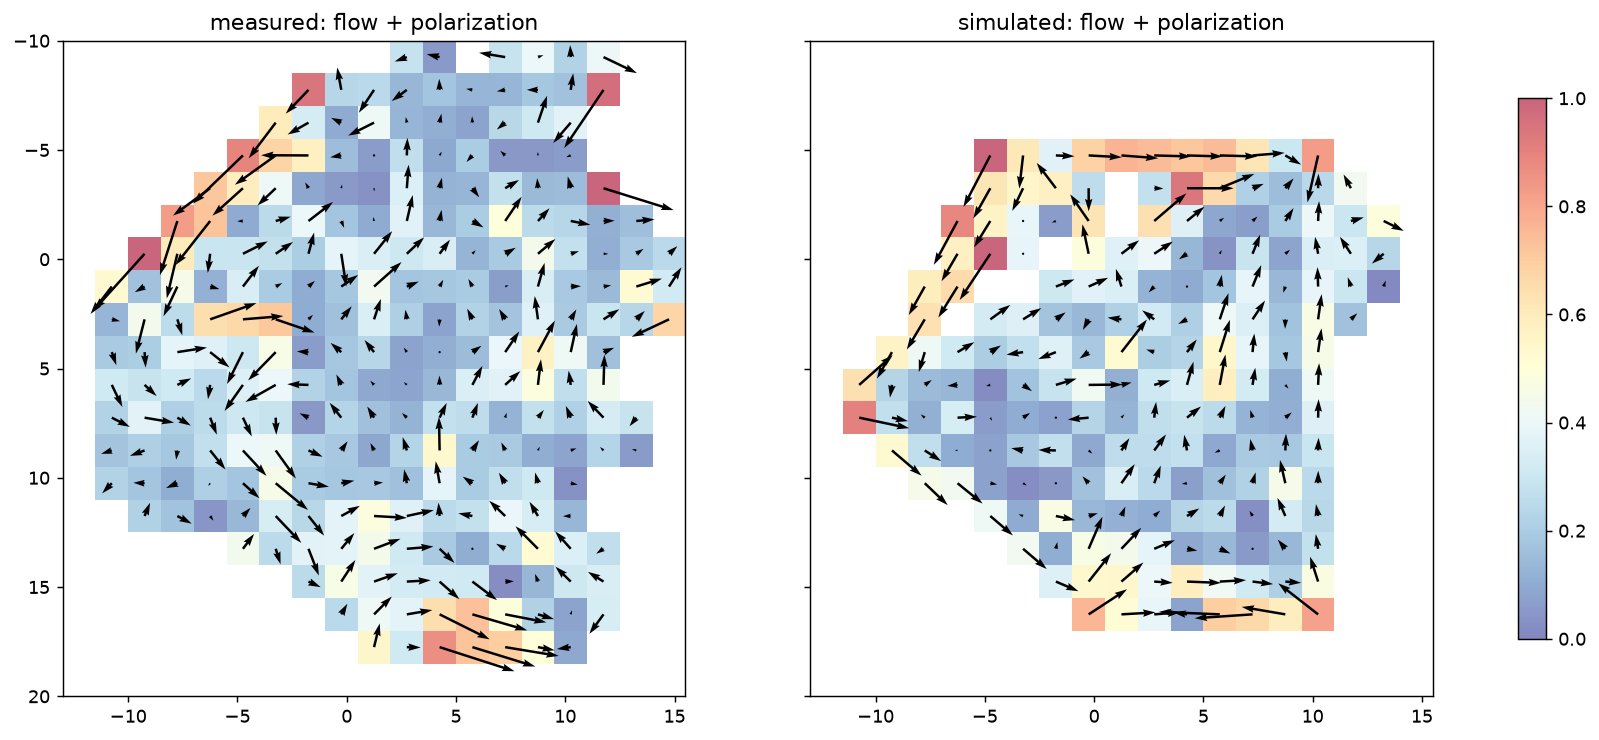
Where the model holds: direction of flow, measured (left) and simulated (right). Color shows how one-directional each cell is; blue means people cross it in all directions.
Where the model fails
It does not reproduce the spatial spread. Simulated agents walk gate-to-gate along shortest paths, so the occupancy map shows narrow corridors. The measured map is spread over the whole floor, because real visitors also wander. The simulation also stands less: 17% of person-time against 29% measured. The demand model only knows discrete stops longer than two seconds, while real standing includes shuffling, micro-pauses and slow reorientation.
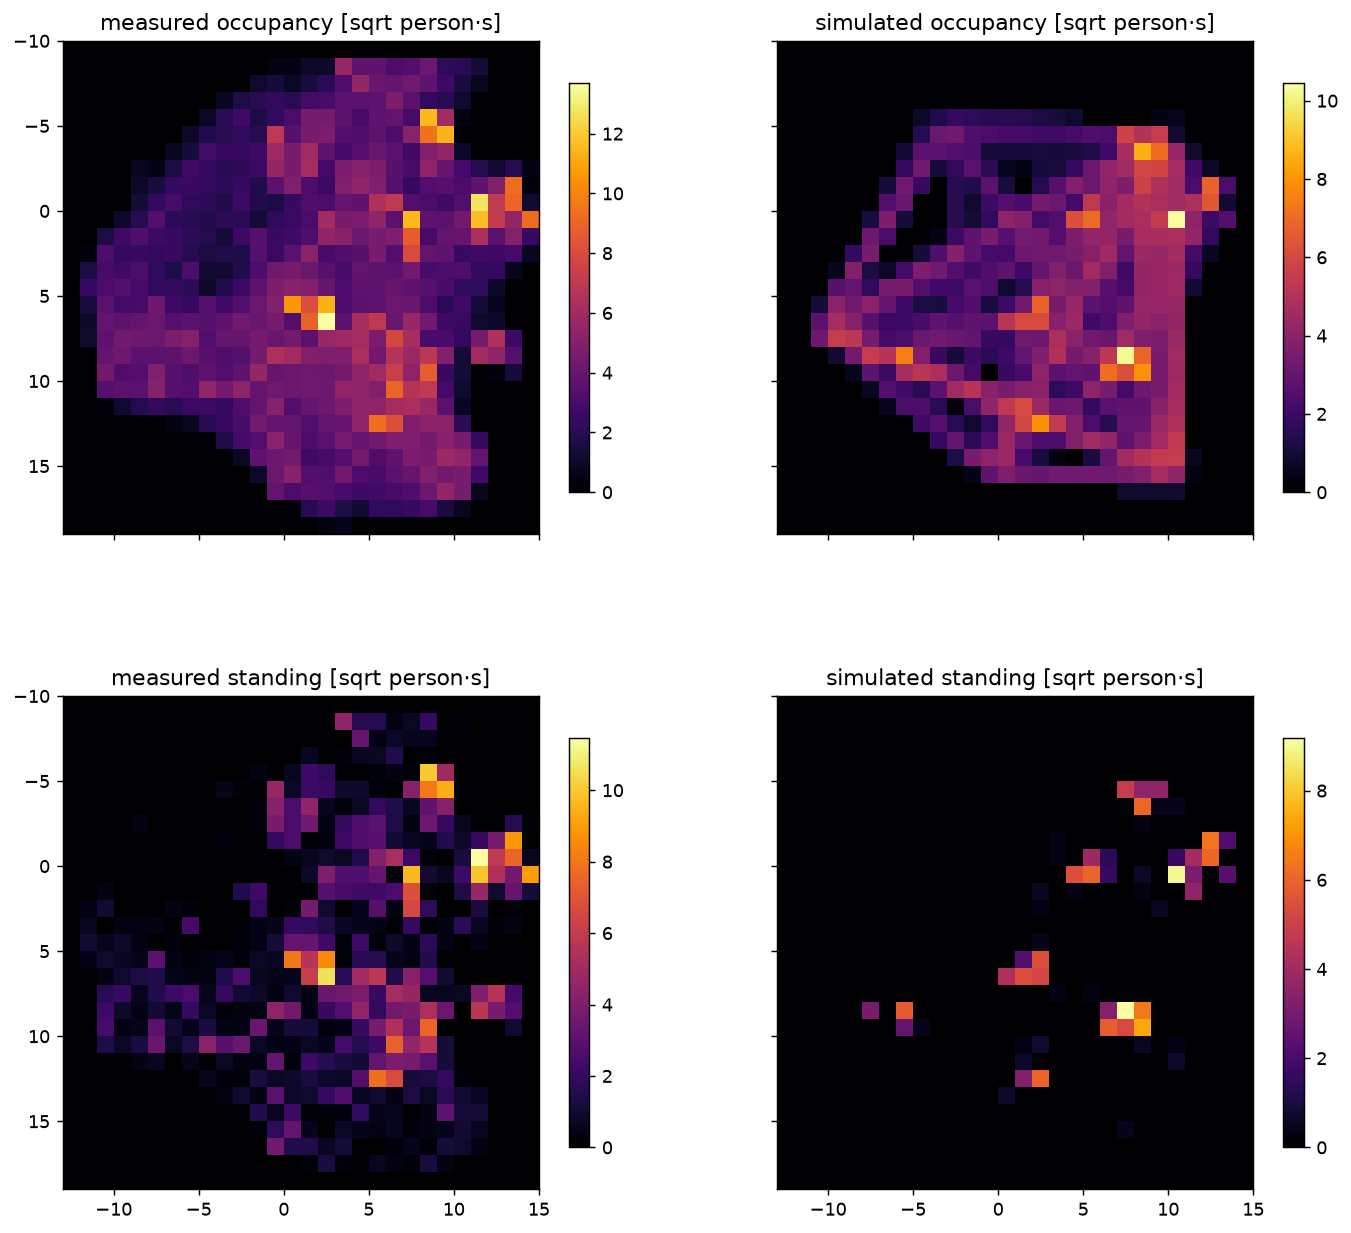
Measured occupancy and standing (left) against simulated (right). The measured occupancy is spread over the floor; the simulated one collapses onto gate-to-gate corridors.
This is a known limitation. Current locomotion models are built for directed walking. The exploratory part of museum behavior has to be added on top, for example as noise in the desired direction or as soft intermediate attractors. What the data gives us is a measure of how large that part is, which is what a model needs for calibration.
Run it yourself
We packed the scenario (geometry, gates, stop points, arrival rates) into a file for the web app. Download guggenheim_atrium.zip, open it at app.jupedsim.org and run the atrium in the browser, no installation.
Everything ran on one laptop with open-source tools: JuPedSim for the simulation, the analysis in Python. The video, code and trajectories fit in a folder.
Code and data
Code, trajectories and the detailed results: github.com/PedestrianDynamics/guggenheim-atrium
By: Mohcine Chraibi