Test 7: Allocation of demographic parameters
PASS1. Definition
A group of adults is chosen from Fig. 3, which gives mean walking speed on level ground as a function of age after Weidmann, with a band of one standard deviation. Walking speeds are distributed over a population of 50 persons. The test shows that the distribution of simulated walking speeds is consistent with the distribution in the figure.
Source: RiMEA 4.1.1, Test 7, p. 31; Fig. 3, p. 13 (the English text of Test 7 cites Figure 2 and a table, the German text cites Abb. 3). This is a paraphrase, not the text of the standard.
Reference: RiMEA e.V. (2025). RiMEA: Richtlinie für Mikroskopische Entfluchtungsanalysen / Guideline for Microscopic Evacuation Analysis, version 4.1.1. https://rimea.de/ (Page numbers are the page numbers of the bilingual guideline (n / 56).)
2. Scenario
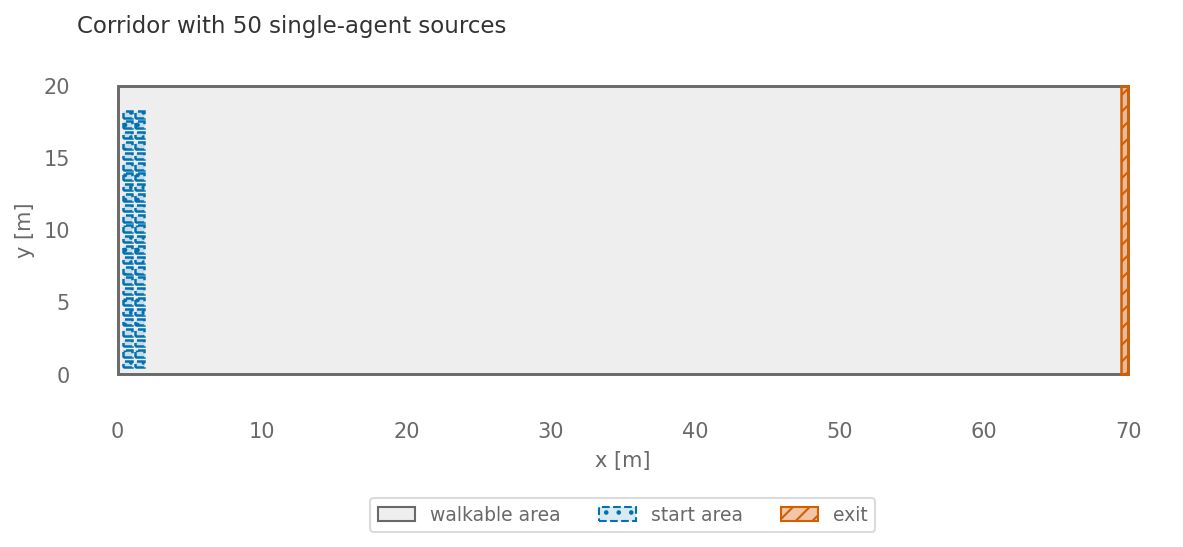
Scenario figure from the executed notebook.
3. What to expect
The simulated speed distribution is consistent with Fig. 3. RiMEA gives no measure of agreement and sets no fixed pass limit (p. 28).
Our criterion: Speed distribution matches the age-based table
4. Our result
Status: PASS
Test cases of this row
| Case | Status | Result | Run | ||||||||||||||
|---|---|---|---|---|---|---|---|---|---|---|---|---|---|---|---|---|---|
test_ | PASS | observed_speed_by_age (m/s) 6 values Download CSV Show values
| n = 50 · seed 42 |
test_: bound per age group: assigned speed in reference range (tol 1e-06); observed median speed in reference range +/- 0.03 m/s; comparison: mean observed speed non-increasing with agespeed_ distribution
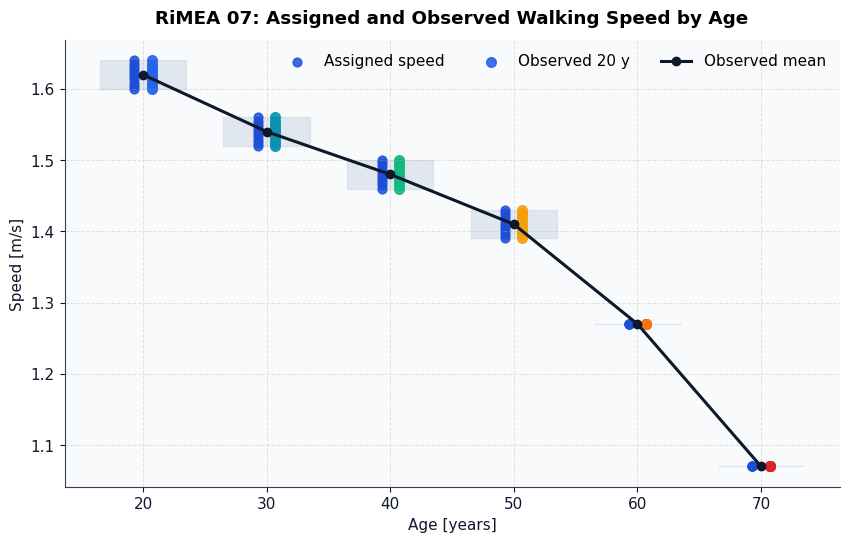
Result figure from the executed notebook.
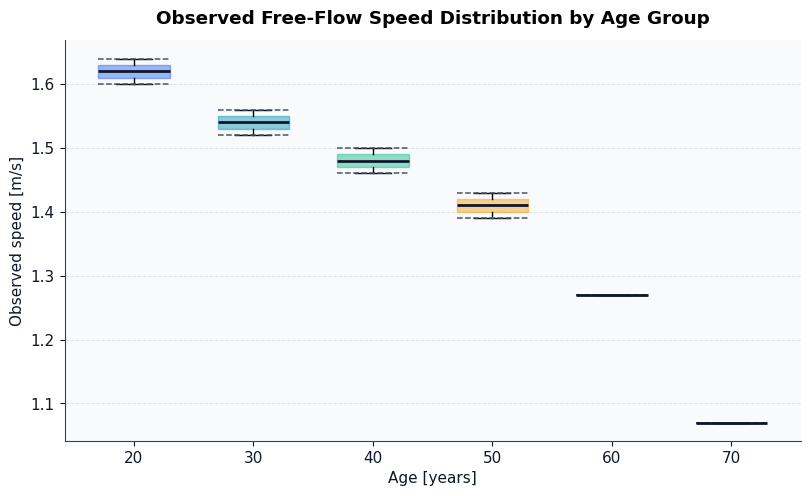
Result figure from the executed notebook.
5. Our implementation
Deviations from the standard:
- The population has 50 adults at the ages 20, 30, 40, 50, 60 and 70 years (10, 10, 10, 10, 5 and 5 persons); the age mix is the suite’s own choice. Each age gets speeds inside a band 0.04 m/s wide around the mean curve of Fig. 3 (single values of 1.27 and 1.07 m/s at ages 60 and 70). The spread of about 0.3 m/s near age 20 shown in Fig. 3 is not reproduced.
- The pass rule is the suite’s own: assigned speeds lie in the age band, the median observed speed of each agent lies in the band within 0.03 m/s, and the mean observed speed does not rise with age. The observed speeds come from free walking in a room of 70 m by 20 m, so the test shows that agents reach their assigned speed.
Model: CollisionFreeSpeedModel
- Test function: tests/vv/test_rimea.py::test_speed_distribution