Test 4: Measurement of the fundamental diagram
PASS1. Definition
A corridor 1000 m long and 10 m wide carries three measuring areas of 2 m by 2 m at about 450, 500 and 550 m. The middle area is the main one; the other two are controls. The corridor is filled with persons of nearly equal free speed (for example 1.2 to 1.4 m/s) at 0.5, 1, 2, 3, 4, 5 and 6 persons per m². At each area the mean speed over 60 s is determined; the first 10 s may be dropped as a transient. The fundamental diagrams follow from the results, with flow equal to speed times density. In a second step the corridor is narrowed until persons can only walk one behind the other without overtaking, and the diagram is checked again for this line movement.
Source: RiMEA 4.1.1, Test 4, pp. 29-30, Fig. 5 (the English text calls it Figure 4). This is a paraphrase, not the text of the standard.
Reference: RiMEA e.V. (2025). RiMEA: Richtlinie für Mikroskopische Entfluchtungsanalysen / Guideline for Microscopic Evacuation Analysis, version 4.1.1. https://rimea.de/ (Page numbers are the page numbers of the bilingual guideline (n / 56).)
2. Scenario
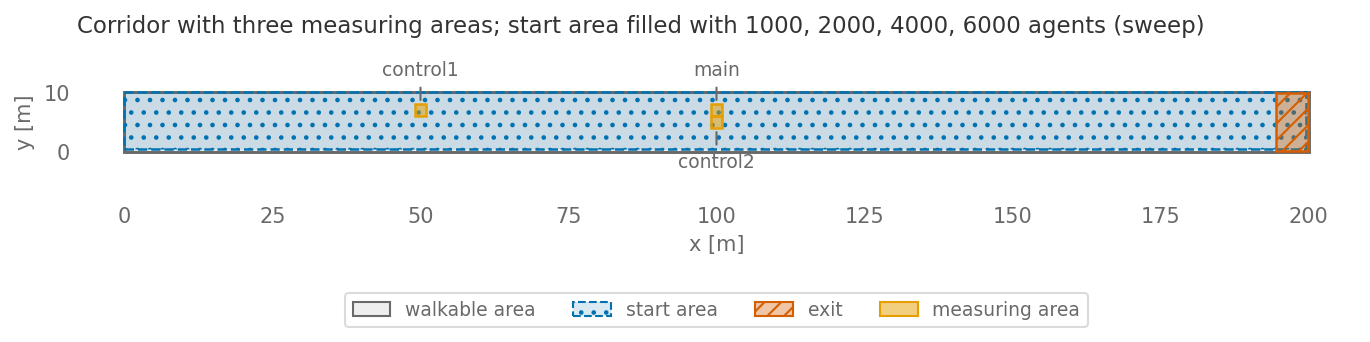
Scenario figure from the executed notebook.
3. What to expect
RiMEA names no values: the speed-density and flow-density diagrams are to be created from the measurements. It notes that empirical data exist for this test (p. 22). RiMEA sets no fixed pass limit (p. 28).
Our criterion: Local density increases with population and walking speed does not increase with density
4. Our result
Status: PASS
Test cases of this row
| Case | Status | Result | Run | |||||||||||||||||||||||||||||||||||||||||||||||||||||||||||||||||
|---|---|---|---|---|---|---|---|---|---|---|---|---|---|---|---|---|---|---|---|---|---|---|---|---|---|---|---|---|---|---|---|---|---|---|---|---|---|---|---|---|---|---|---|---|---|---|---|---|---|---|---|---|---|---|---|---|---|---|---|---|---|---|---|---|---|---|---|---|
test_ | PASS | density_speed_flow_by_population (P/m^2, m/s, P/(m s)) 3 groups × 3 series × 4 points Download CSV Show values
| n = 6000 · seed 42 |
test_: comparison over populations [1000, 2000, 4000, 6000]: density strictly increases; bound: speed rise between consecutive populations <= 0.05 m/s; window 10-60 s, per measuring areaspeed_ density_ relation
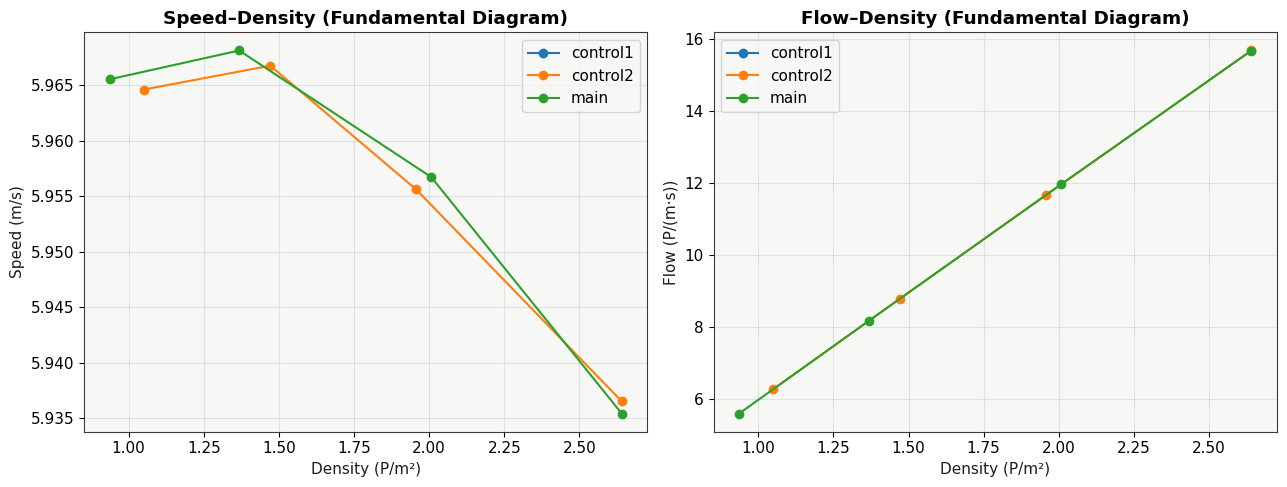
Result figure from the executed notebook.
5. Our implementation
Deviations from the standard:
- The corridor is 200 m long and 10 m wide, one fifth of the specified length. The areas sit at x = 50 m (control) and x = 100 m (main, and a second control beside it), not around 450 to 550 m.
- The runs use 1000, 2000, 4000 and 6000 agents, which gives about 0.5, 1, 2 and 3 persons per m². The densities 4, 5 and 6 persons per m² are not run.
- The single-file line-movement case is not run.
- Agents start spread over the whole corridor and walk to an exit at the downstream end. The corridor is not periodic, so the density in an area is a mean over the 10 to 60 s window and is not held fixed.
- The pass rule is the suite’s own: at each area the measured density rises with the agent count, and the mean speed does not rise by more than 0.05 m/s from one density level to the next. Flow is computed as speed times density and is not asserted.
Model: WarpDriverModel
- Test function: tests/vv/test_rimea.py::test_speed_density_relation
- Scenario file: Rimea-04-fundamental-diagram.zip