Test 13: Fundamental diagram on stairs
PASS1. Definition
Two geometries differ only in the direction of the stair (Fig. 17): a room of 10 m by 10 m opens into a corridor 2 m wide that holds a stair 5 m long between a 2 m approach and a 2 m exit leg. The captions of Fig. 17 disagree (German: downwards, English: upwards); the sketch serves both directions. 100 agents of the RiMEA standard population, with no response time, start in the room and walk to the goal. Speed and density refer to the horizontally projected stair area. Field data (Fig. 16) show lower speeds upwards than downwards. The test shows that the walking speeds lie within the spread of Fig. 16 and that they are higher downwards than upwards.
Source: RiMEA 4.1.1, Test 13, pp. 42-43, Figs. 16 and 17; stair speeds: Table 3, p. 15. This is a paraphrase, not the text of the standard.
Reference: RiMEA e.V. (2025). RiMEA: Richtlinie für Mikroskopische Entfluchtungsanalysen / Guideline for Microscopic Evacuation Analysis, version 4.1.1. https://rimea.de/ (Page numbers are the page numbers of the bilingual guideline (n / 56).)
2. Scenario
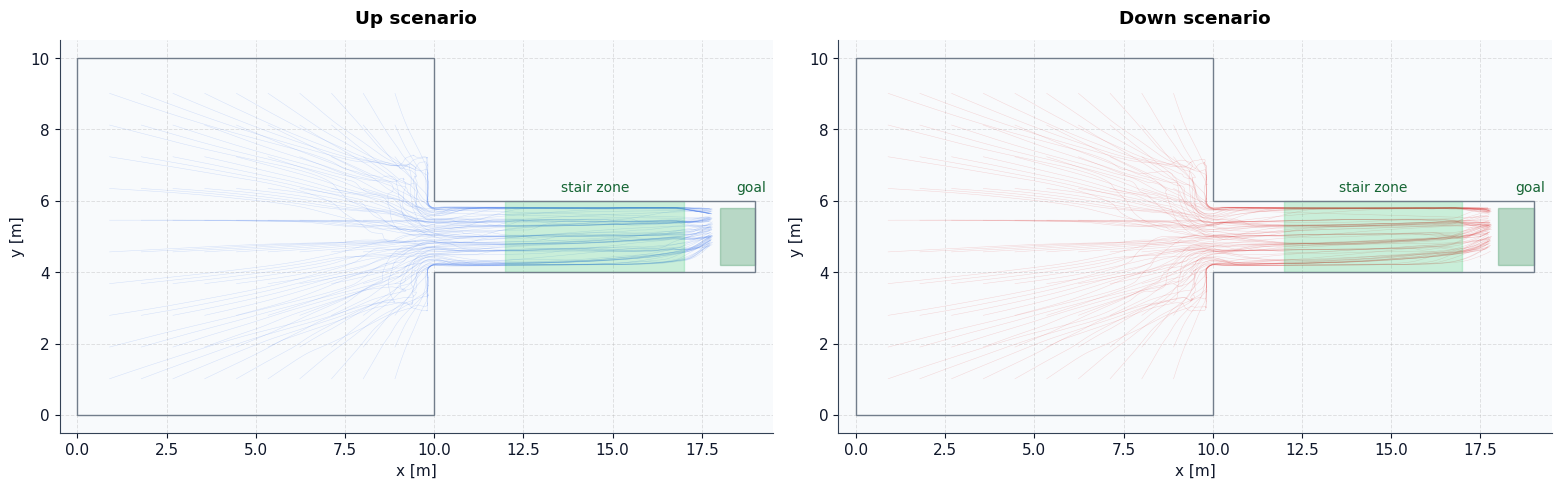
Scenario figure from the executed notebook.
3. What to expect
The speeds lie within the spread of the field data in Fig. 16 and are higher on the way down than on the way up. RiMEA sets no further pass limit (p. 28).
Our criterion: Down-stair speed > up-stair speed
Deviates from RiMEA 4.1.1, which wants stair speeds within the Abb. 16 spread: the test only requires at least 25% of the points inside the coded band and publishes the measured inside-band fraction per direction in the results table. The band (the suite’s own, source pending; compare RiMEA Abb. 16) and the RiMEA standard population (section 3.2.4) are not yet checked.
4. Our result
Status: PASS
Test cases of this row
| Case | Status | Result | Run |
|---|---|---|---|
test_ | PASS | stair_speed_mean_up_and_down (m/s) mean_speed_up: 0.5536 mean_speed_down: 0.757 samples_up: 918 samples_down: 853 inside_band_up: 0.9978 inside_band_down: 0.5487 shared_bins: 10 down_wins_fraction: 1 bin_mean_speed_up: 0.5391 bin_mean_speed_down: 0.7142 | n = 100 · seed 42 |
test_: bound: inside the suite band (source pending) >= 0.25 (up and down); bound: samples > 500 per direction; bound: shared density bins >= 5; bound: fraction of shared bins with down > up >= 0.7; comparison: bin-mean speed over shared bins, down > updown_ faster_ than_ up
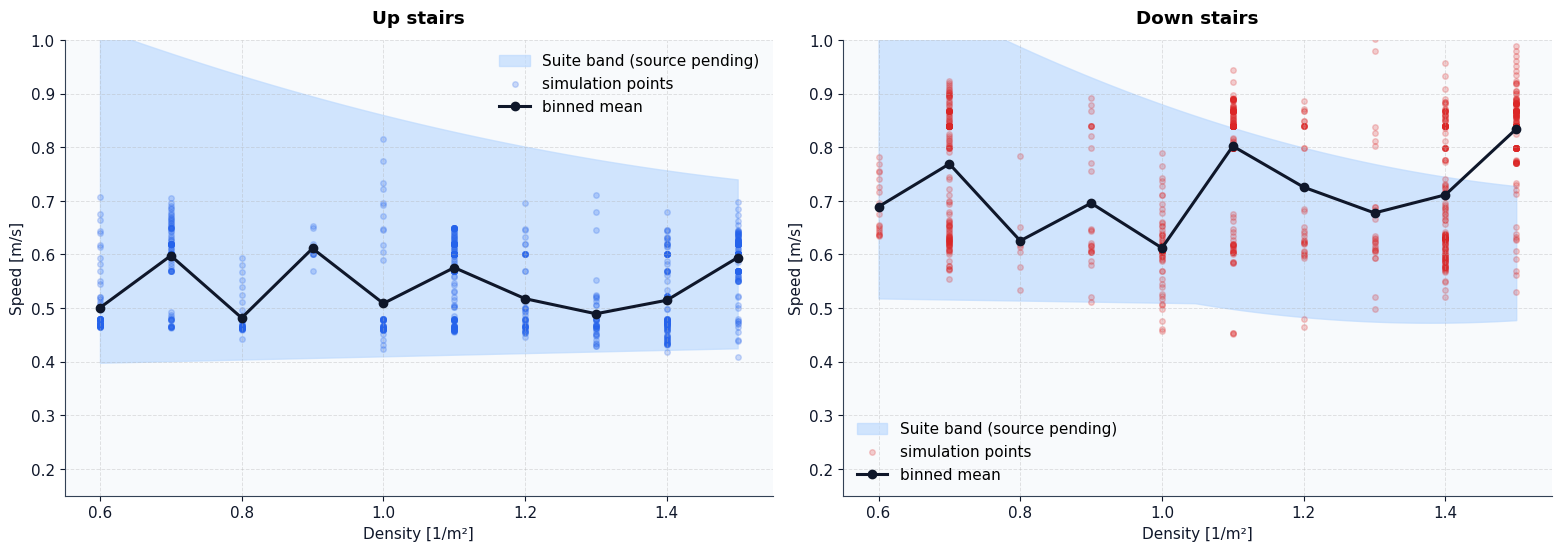
Result figure from the executed notebook.
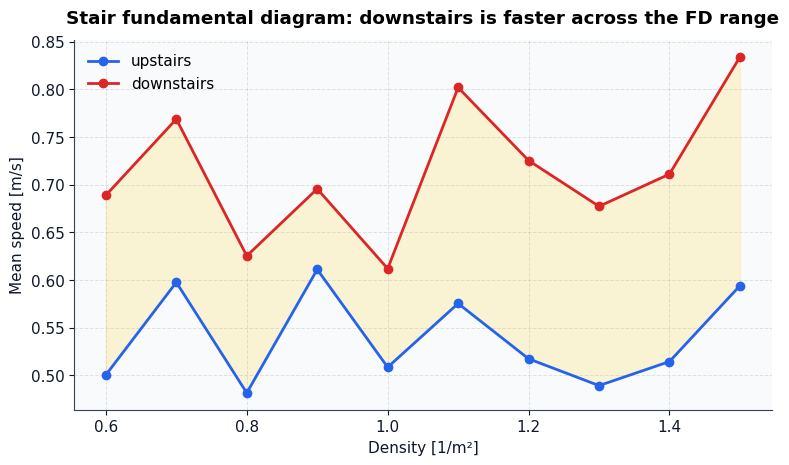
Result figure from the executed notebook.
5. Our implementation
Deviations from the standard:
- The stair is a flat zone of 5 m by 2 m in the corridor with speed factors of 0.5 (up) and 0.7 (down), not a stair object. That the downward speed exceeds the upward speed is largely set by these input factors.
- The 100 agents form seven groups with desired speeds from 0.96 to 1.34 m/s, labelled after the groups of Table 3. This is not the RiMEA standard population (section 3.2.4, p. 16: 50 % men and 50 % women, age normally distributed with mean 50 and standard deviation 20 years, 10 to 85 years). Agents have the default radius of 0.15 m.
- The spread of Fig. 16 is replaced by a coded envelope (mean plus or minus one standard deviation of a fast and a slow sub-population, function corbetta_envelope_bounds in standards/rimea/scenario_builders/rimea13_stairs.py). Its coefficients are not yet checked against Fig. 16.
- The pass rule is the suite’s own (decision D13): at least 25 % of the speed samples of each direction lie inside the coded envelope, at least 70 % of the shared density bins (0.6 to 1.5 persons per m²) show a higher speed downwards, and the mean over those bins is higher downwards. The test publishes the fraction inside the envelope for each direction. RiMEA asks for all speeds to lie within the spread.
Model: CollisionFreeSpeedModel
- Test function: tests/vv/test_rimea.py::test_down_faster_than_up