The Dynamics of Waiting
In many daily situations, as in city centres or public transportation facilities, the dynamics of crowds are dominated by the presence of standing or waiting pedestrians. However, pedestrian’s waiting behaviour and interactions with moving persons has only rarely been studied. For example, in the fundamental diagram or in level of service concepts, waiting pedestrians are solely included while standing in queues. Standing in a queue with all surrounding pedestrians orienting in the same direction and probably sharing the same goal to reach, differs significantly from situations in which pedestrians can freely choose their waiting places, such as on platform of a train station.
In order to increase the understanding of waiting pedestrians, we contributed a methodology and analysis to describe waiting passengers and their influence on the processes at railway platforms as part of the BMBF-funded project “CroMa - Crowd Management in transportation infrastructures”. The detailed results can be found in publications [1], [2], [3], [4] and will shortly be presented in the following sections.
Field Studies
Studying trajectory data from railway stations, which were kindly provided by Swiss Federal Railways (SBB AG), it became clear that the variability of types of users is important when describing how the space at railway platforms is used. While alighting passengers mostly leave the platform directly, boarding passengers spend a significant amount of time waiting. Therewith their trajectories cover a larger area of the platform and exhibit certain waiting places which can be identified by ‘knots’ in the trajectories.
Trajectories of boarding (red) and alighting passengers (blue) at Zürich Hardbrücke, Switzerland, in an exemplary time interval of one hour during the afternoon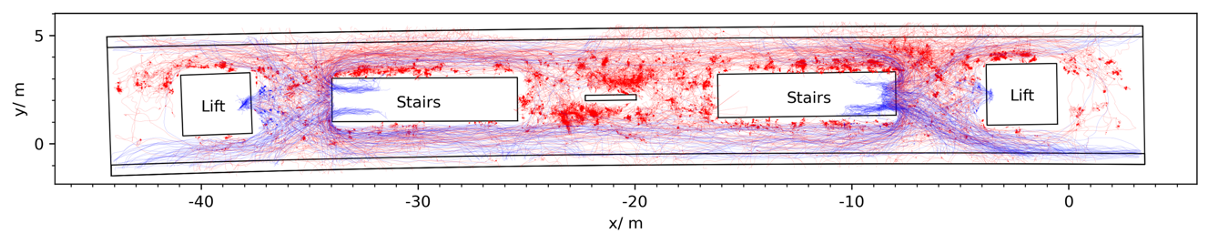
Additionally, the presence of waiting passengers causes the distribution of mean speeds to show a double peak structure: one peak at lower speeds representing the boarding passengers, the second peak corresponding to alighting and moving passengers. Details can be found in [1].
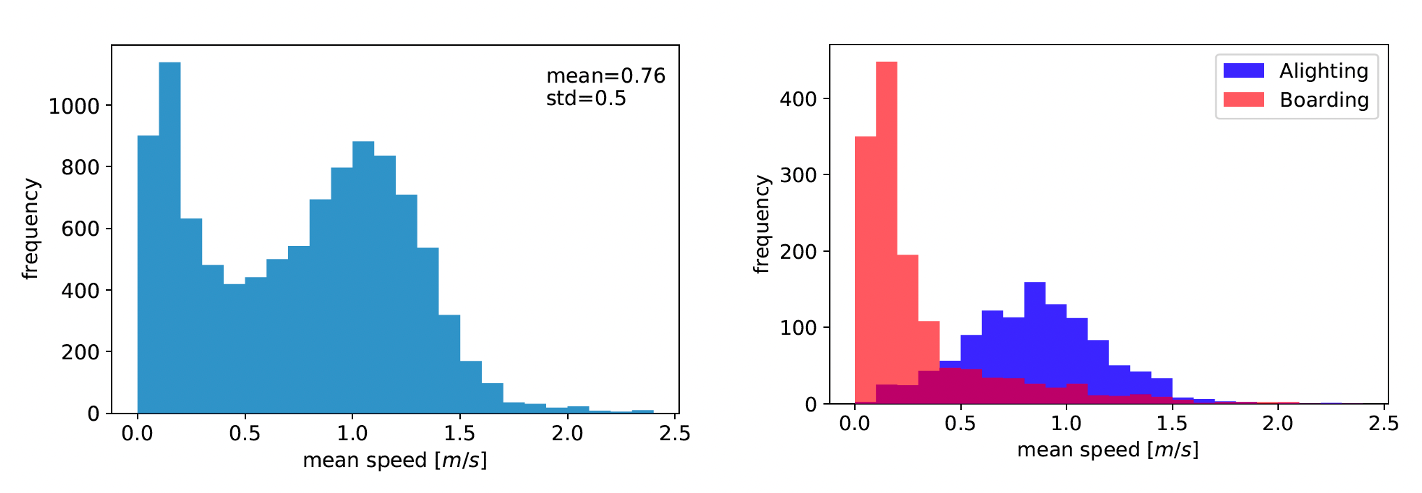
Left: Mean speed of all passengers during afternoon peak hours in Bern, Switzerland; Right: mean speed of boarders (red) and alighters (blue)
Social Groups and Waiting Time
In order to analyse the waiting places of passengers and their space occupancy, in the following investigations a passenger is considered as waiting with a speed less than 0.4 m/s. This threshold was determined through the mean speed distributions of boarding and alighting passengers.
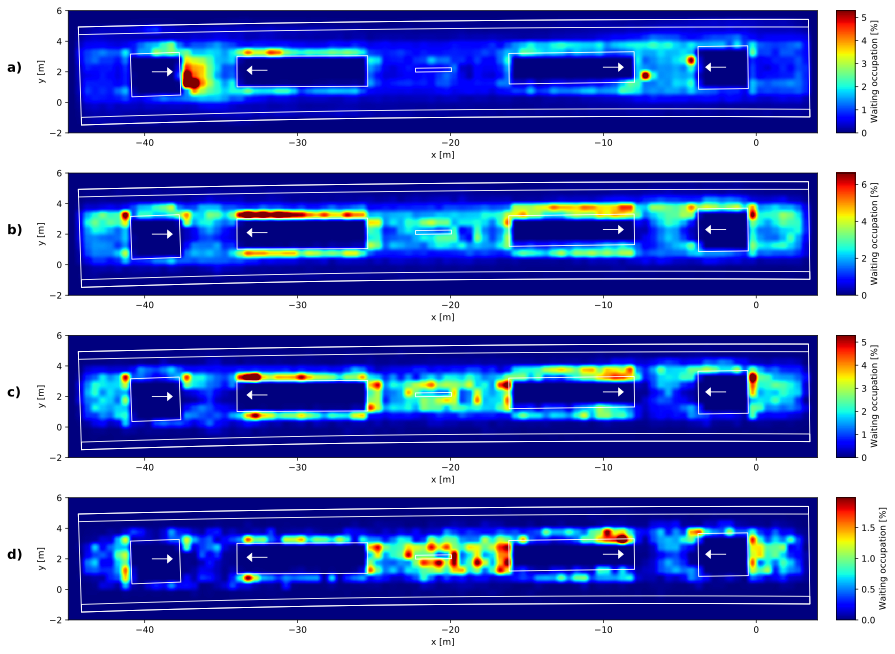
Previous research in the field of pedestrian dynamics highlighted the importance to consider differences between social groups and individuals, and also introduced methods to detect those in trajectory data. We used trajectory data collected in February 2020 (28 days) during the afternoon peak hours (4 p.m. to 7 p.m.). We found a lower passenger amount on weekends but a higher percentage of social group members than on working days. Independent of the day of the week, the most frequent group size were pairs. While individual passengers often wait at the sides of stairs and obstacles, social groups with a higher number of members are more likely to wait in front of the platform’s entrances. Social groups position themselves in a way that ensures the groups communication, mainly in circles, which results in higher space requirements. Waiting places of social groups and individuals. a) individuals b) groups with 2-3 members c) groups with 4-5 members d) groups with 6 and more members Waiting places depending on total waiting time a) up to 2 min b) 2-5 min c) 5-10 min d) 10 min and more. The waiting occupation of a certain area states the percentage of time this area is occupied by a waiting pedestrian.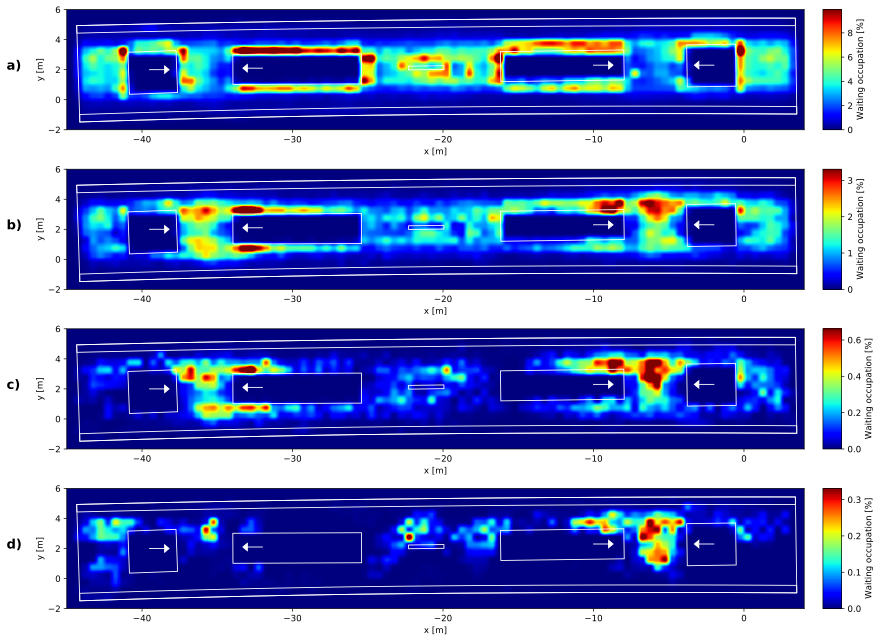
Experiments
As the field studies revealed a higher number of influencing factors, in the next step, large-scale laboratory experiments were conducted [3]. These offer the possibility to study some influencing factors in a controlled environment and under reduced complexity. As variations the setup of the platform (no, narrow or wide obstacle), the number of participants (40 or 100) and their waiting time (2 or 4 minutes) were chosen. The side of train arrival was not varied and known to the participants. Hence, their attention is focused towards the corresponding side and an alignment of viewing directions can be observed.
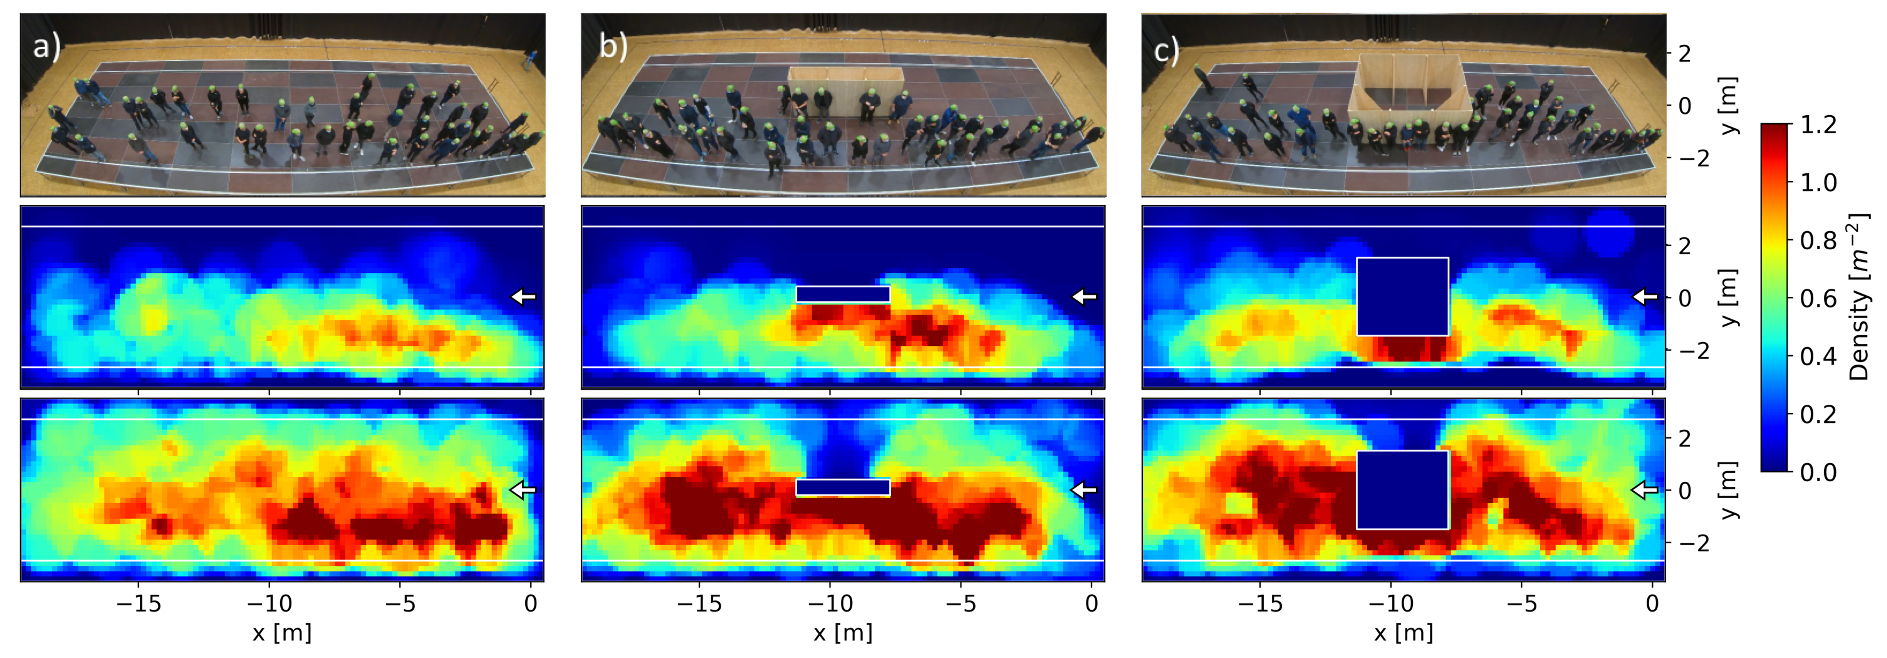
Upper panel: experiment setup for 40 participant showing their positions at the end of the waiting time; middle: density profiles for 2 minutes waiting time and 40 participants; lower panel: for 100 participants
During analysis of density profiles, platforms without obstacles were found to lead to uneven passenger distributions as the area close to the entrance was favoured. Obstacles were found to have a two-sided effect: the side facing towards the train arrival is a preferred waiting spot while the opposite side has a repulsive effect. Possible reasons for these effects are the comfort provided by leaning against the obstacle and the reduction of the number of neighbouring persons; the repulsive effects are likely caused by the blocked line of sight towards the goal. Narrow obstacles cause passengers to mainly wait at the side of expected train arrival, while wide obstacles, despite blocking the passenger’s view, lead to a more even distribution along the platform. Even though the marked safety line at the platform’s edges was not mentioned in the experiment’s instructions, participants keep a distance to the edges and seldom cross the safety line.
Floor Fields
Based on the results from both field and experimental studies, pedestrians choose their waiting positions as a trade-off between different factors. These factors can be transferred into floor fields, as previously introduced by [5]. Schematic illustration of influencing factors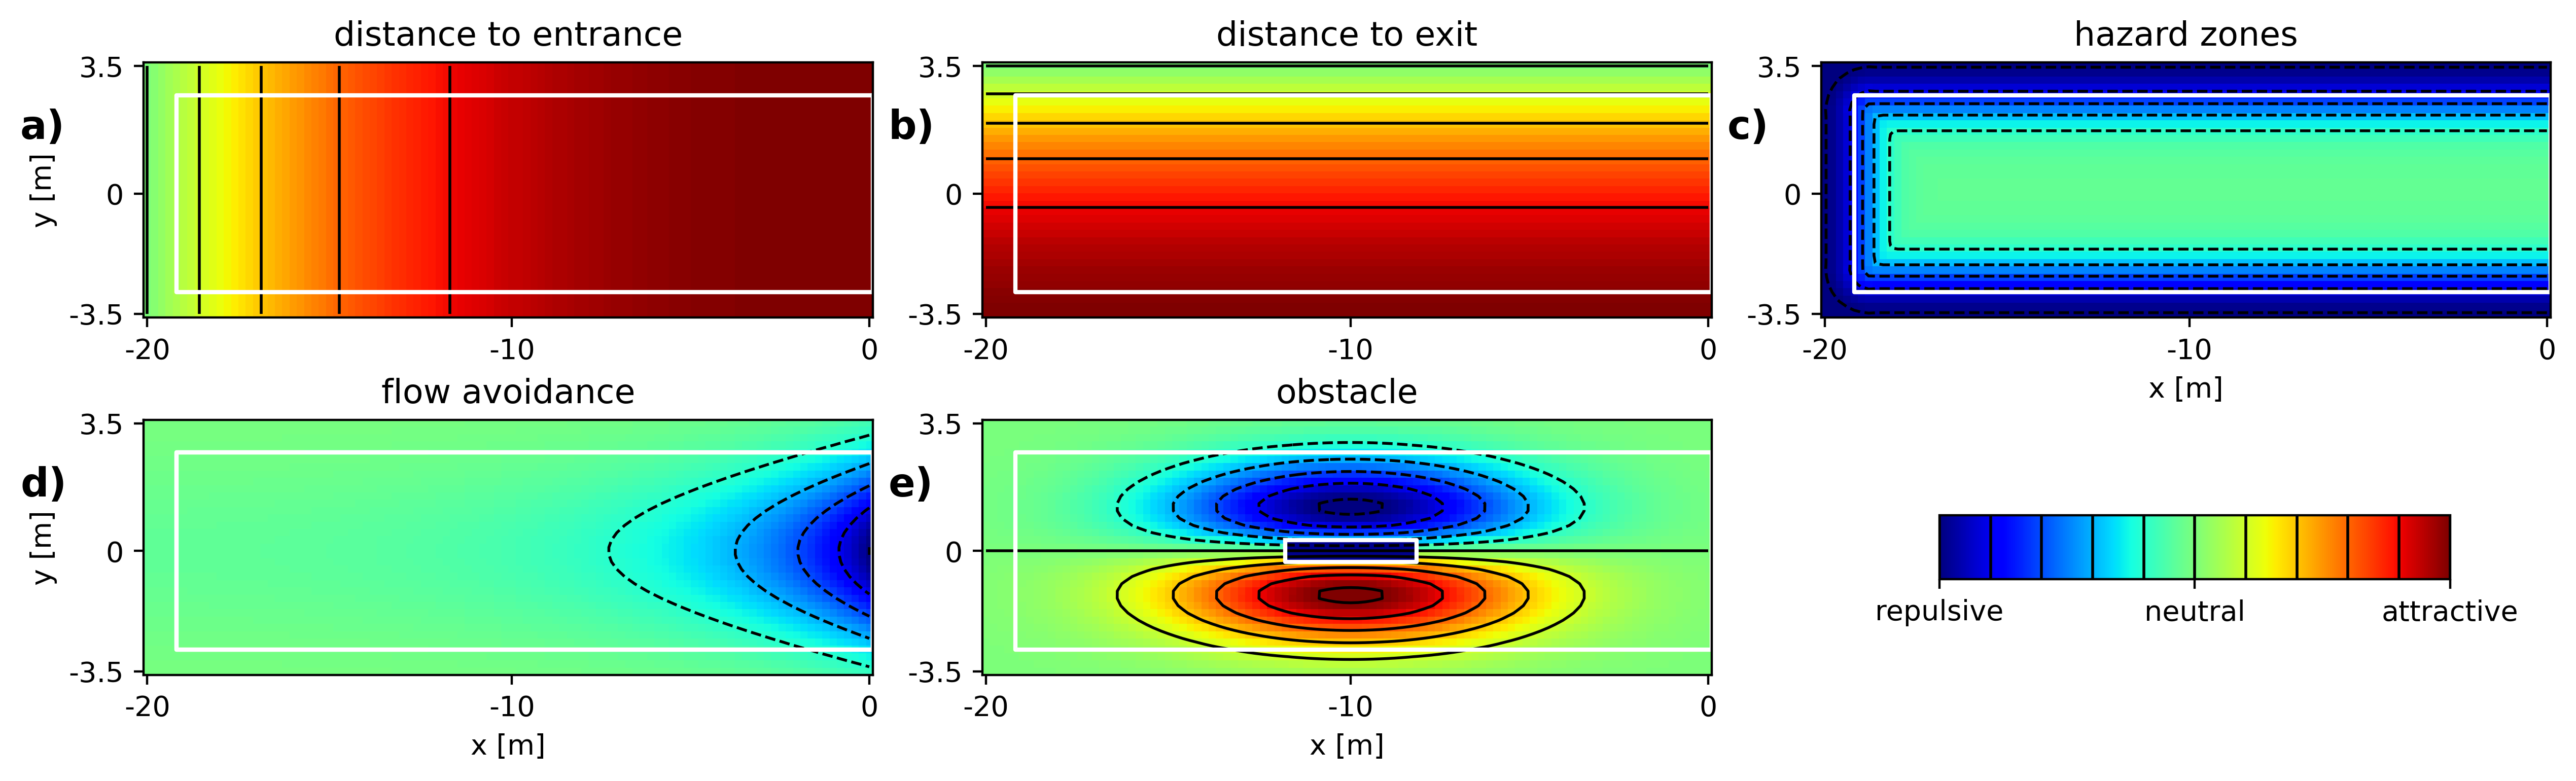
a) Distance to entrance: Passengers prefer places in the vicinity of the entrance and do not walk to the far side of the platform.
b) Distance to exit: Passengers stay at the side of expected train arrival.
c) Hazard zones: Platform edges have a repulsive effect.
d) Flow avoidance: Passengers avoid places where they often get in the way of others and are perceived as obstacle.
e) Stationary obstacles: Obstacles have a two-sided effect: the side facing train arrival acts attractive, the opposite side as repulsive.
Using a superposition of these factors, an estimate of attractiveness of waiting places can be generated. Floor fields of attractiveness of waiting positions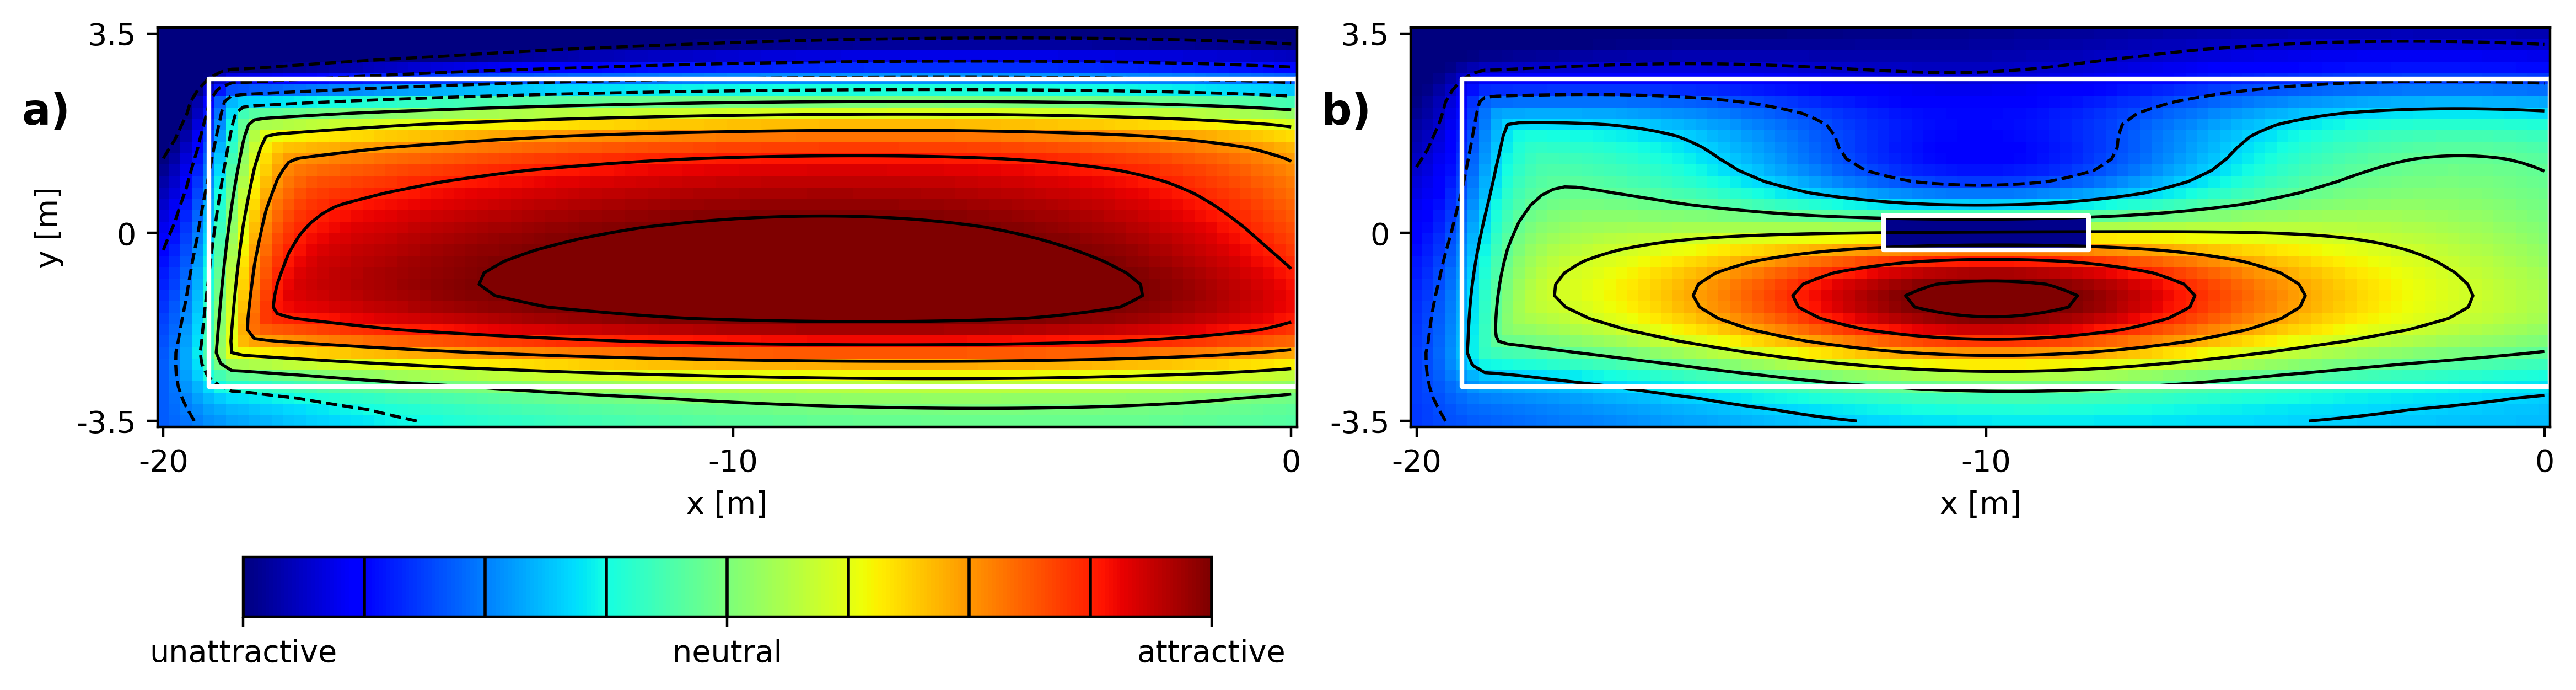
Outlook
While the investigations were performed in the context of railway platforms, the results can likely be transferred to other situations in which waiting pedestrians are predominant. This is the case in many situations, e.g. during filling processes, in public spaces or during events. Even in queueing experiments pedestrians can often be observed to wait rather than actively try to move towards the exit. Investigations on waiting pedestrians can therefore enhance the understanding of crowd dynamics and are beneficial to include in simulation algorithms. However, there are still many open questions and potential for future works [4].
By: Mira Küpper
References
- [1] Küpper, M. ; Seyfried, A.: Analysis of Space Usage on Train Station Platforms Based on Trajectory Data. Sustainability 12, no. 20: 8325 (2020)
https://doi.org/10.3390/su12208325 - [2] Küpper,M.; Seyfried, A.: Identification of social groups and waiting pedestrians at railway platforms using trajectory data, PlosOne (2023)
https://doi.org/10.1371/journal.pone.0282526 - [3] Küpper, M., Seyfried, A.: Waiting in crowded places: influence of number of pedestrians, waiting time and obstacles. J. R. Soc. Interface 20: 20230193. (2023)
https://doi.org/10.1098/rsif.2023.0193 - [4] Küpper, M.: Space Usage and Waiting Pedestrians at Train Station Platforms, Dissertation Bergische Universität Wuppertal, 2023.
http://dx.doi.org/10.34734/FZJ-2024-00602 - [5] Ezaki, T., Ohtsuka, K., Chraibi, M., Boltes, M., Yanagisawa, D., Seyfried, A., Schadschneider, A., Nishinari, K. (2016). Inflow Process of Pedestrians to a Confined Space. Collective Dynamics, 1, 1–18.
https://doi.org/10.17815/CD.2016.4